Factor rotation means changing how much you hold of value, momentum, quality, low volatility or size as the economic cycle turns. The idea is sound in outline, because these factors do behave differently in different environments. The difficulty is that the best-known evidence says you will probably not be paid for acting on it, and this article tries to treat both halves fairly.
Everything here is educational. It is not investment advice, it names no securities, and the author is not a SEBI-registered Research Analyst or Investment Adviser. The only data in the figure is simulated, and any real-world example is described by method rather than by recent prices.
What the factors are, and why anyone believes in them
A factor is a characteristic that sorts stocks into winners and losers on average, over long periods, for reasons that are not just luck. Five do most of the work: value (cheap relative to fundamentals), momentum (recent winners), quality (profitable, stable businesses), low volatility (calmer stocks), and size (smaller companies).
The foundations are old and well documented. Fama and French (1993) showed that size and book-to-market value explain much of the cross-section of stock returns that the market alone cannot. Carhart (1997) added momentum when studying mutual fund performance, and found that much of what looked like manager skill was exposure to these styles. Asness, Moskowitz and Pedersen (2013) then took value and momentum across eight markets and asset classes, and reported that both premia appear almost everywhere and are negatively correlated with each other.
That last point is the useful one here. Two return streams that are positive on average and move against each other are exactly what portfolio construction wants. A static blend of them is already a respectable answer before any macro view enters.
Quality and low volatility came later in the literature, and their evidence is thinner and more argued over, so hold them with a little less certainty. Size has been the weakest of the five in recent decades and is best treated as a modest effect that shows up unevenly.
Why the cycle should matter to factor returns
Factors do not pay out at a steady rate. Momentum tends to suffer at turning points, when yesterday's leaders and laggards swap places. Low-volatility stocks tend to hold up when growth scares the market and lag when everyone wants risk. Value is a bet on cheap, often cyclical, businesses, and it tends to like recoveries.
There is a reason to expect this beyond the pattern itself. Each factor carries a different mix of discount-rate and growth risk. When liquidity is plentiful and growth surveys are rising, investors pay up for momentum and risk. When policy tightens and the yield curve flattens, they pay for resilience. A tilt towards the factor that suits the regime is the obvious thing to want.
The word to underline is "tend". These are averages over cycles, with exceptions in each one, and a handful of cycles is not many observations to build a trading rule on. That is the honest foundation, and it is thinner than the tidy tables in product brochures suggest.
Macro dials worth watching
A macro overlay needs a few inputs that are cheap to get, change slowly, and mean something economically. Three groups are enough.
Liquidity. How much money is available and how costly it is. Central-bank balance sheets or banking-system liquidity, credit growth and policy rates all belong here. As an Indian worked example, the RBI publishes its liquidity operations in the Weekly Statistical Supplement, and announces the policy rate after each Monetary Policy Committee meeting.
Growth. Survey data move earlier than reported output. Purchasing managers' indices, where a reading above 50 signals expansion among the surveyed firms, are the usual choice, and S&P Global compiles them for many economies. The India series is again just an example of the type.
Policy and the curve. The slope of the yield curve, the change in the policy rate and the stance (easing or tightening) say where the cycle is heading rather than where it is.
Older frameworks often add a fourth input, flows into domestic funds. It is a reasonable sentiment gauge but also a lagging and procyclical one, since flows follow returns, so it deserves a small weight or none.
Building a composite signal and a tilt
The simplest sound method is to standardise each dial against its own history, average them, and read the result as a single number. Zero means a typical environment. Above zero means stronger growth and looser conditions, below zero the reverse.
Standardising matters because a PMI in points and a yield spread in basis points cannot be added otherwise. Equal weights are defensible precisely because fitted weights chase noise, the same estimation trap described in quantitative analysis.
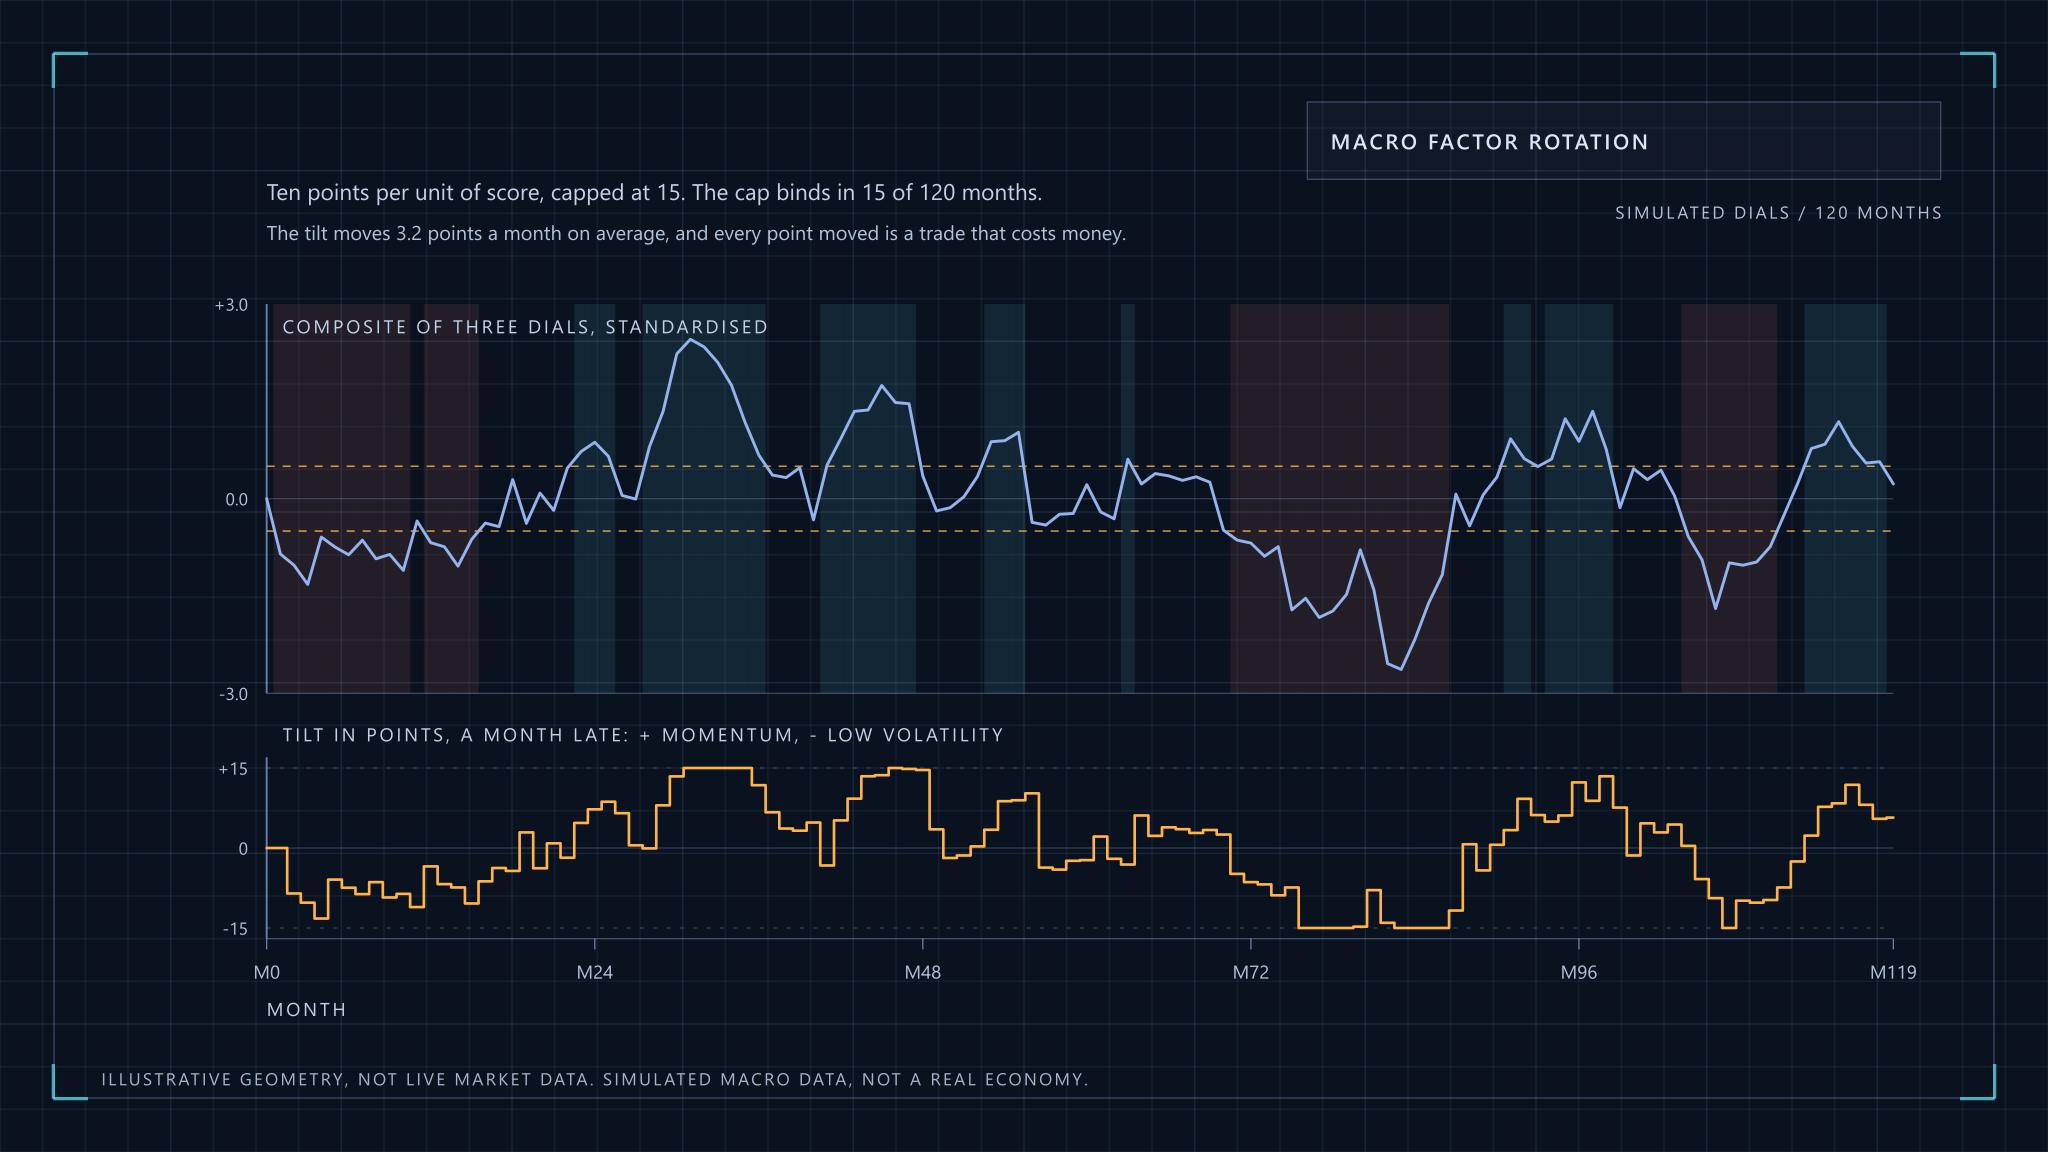
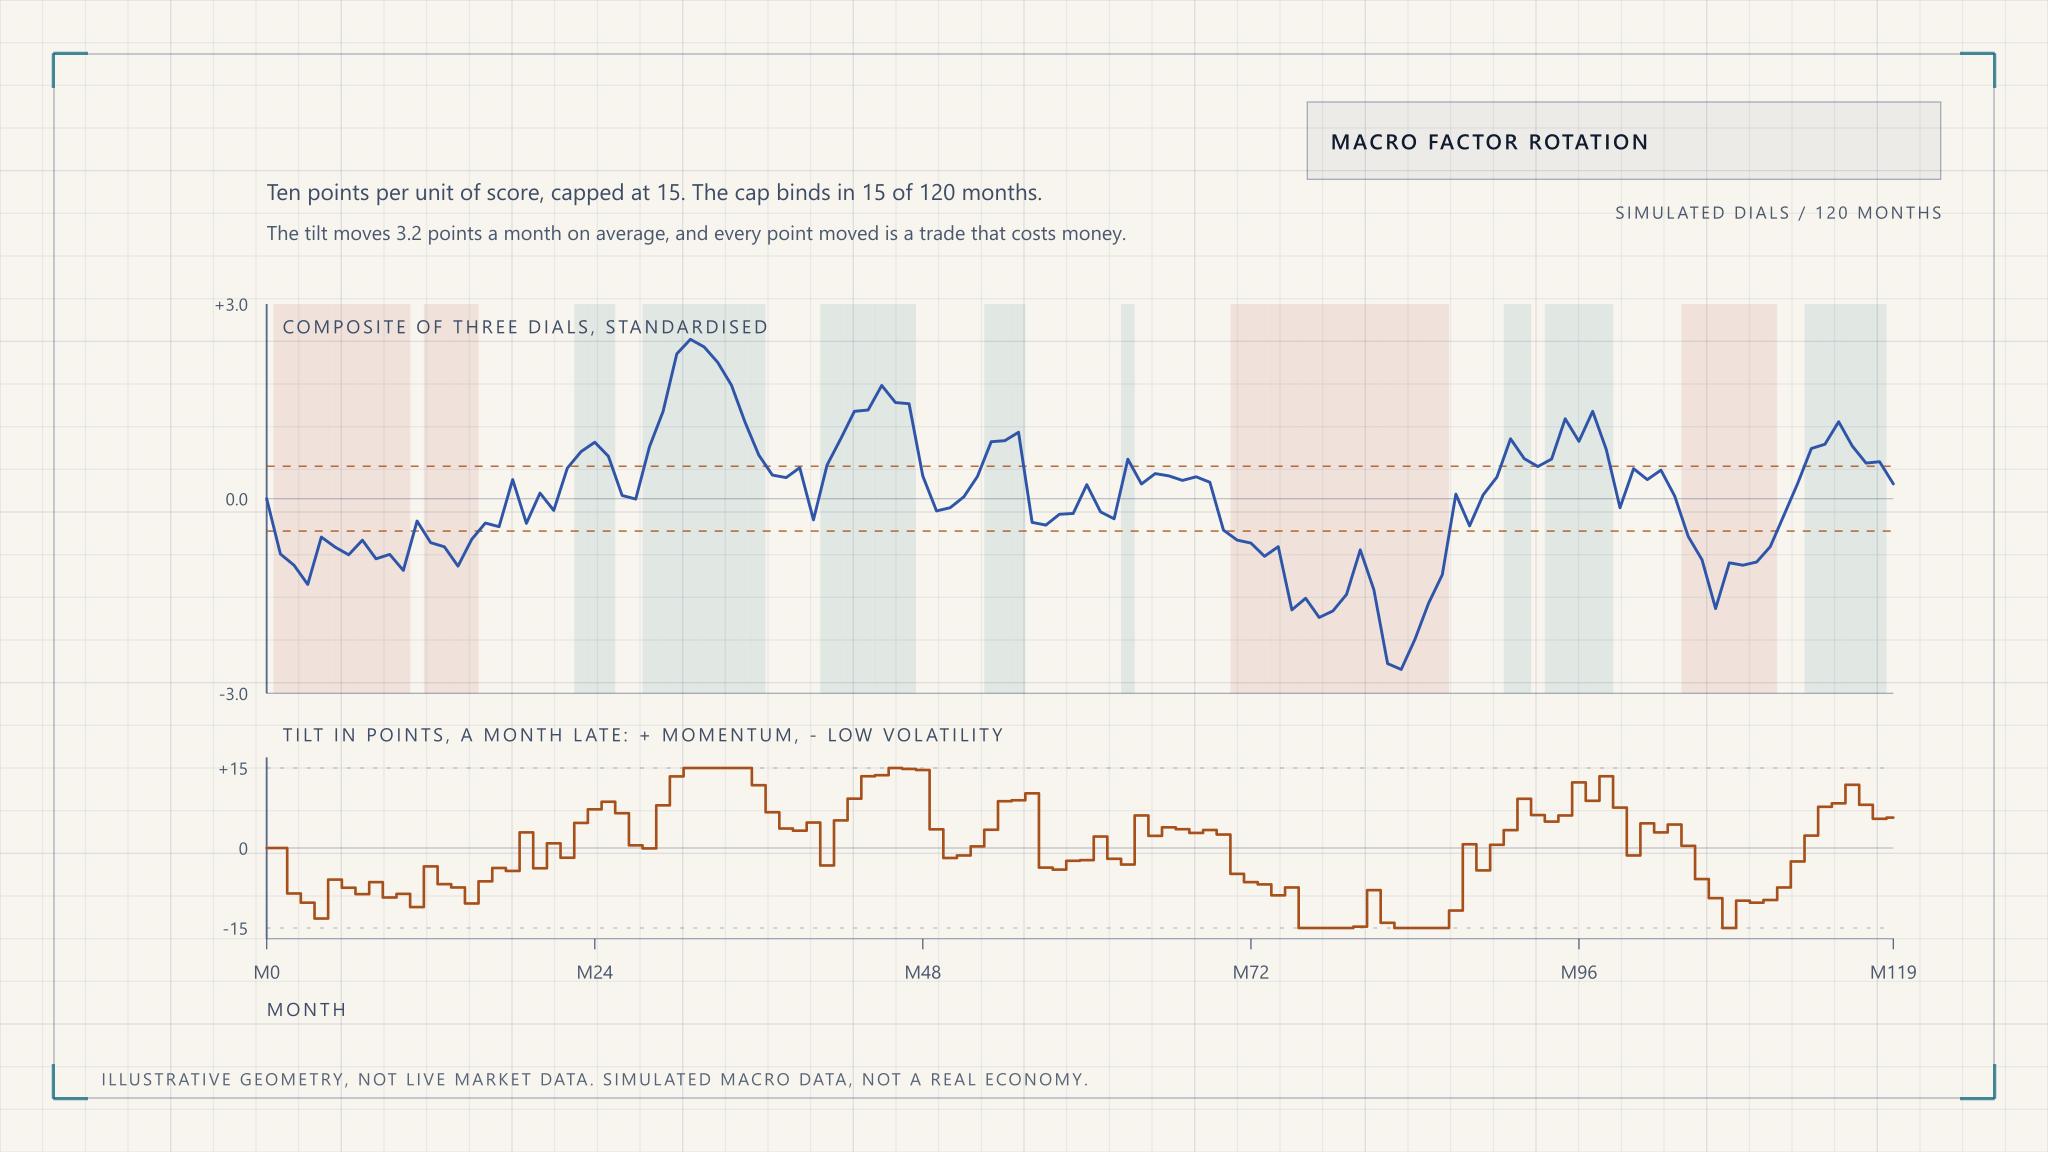
The score then maps to a tilt through a rule written before looking at results: a few percentage points of weight per unit of score, with a hard cap. A threshold rule flips back and forth when the score hovers near its cut-off, and the figure shows what that costs in a simulation.
The simulated score is smooth enough to look tradeable, and yet even this tame example flips its regime label many times and moves the tilt every month. Real data is noisier. A rule that looks clean on a chart can be an expensive rule once it trades.
Two refinements help. Add hysteresis, so the regime changes only when the score crosses a wider band than the one that triggered the last change. And smooth the score over a few months, accepting that you will be late to every turn. Both give up responsiveness for lower turnover, which is usually the right trade.
Guardrails that keep a tilt a tilt
A rotation overlay should be small enough that being wrong is survivable. The point is not to swap a diversified factor portfolio for a single bet, and a rule without limits will quietly do exactly that.
| Guardrail | Typical form | What it protects against |
|---|---|---|
| Tilt cap | No sleeve moves more than a set number of points from its base weight | A bad month of signal turning into a bad year of exposure |
| Turnover budget | Annual one-way trading limit, with changes below a set size not executed | Costs and taxes eating the gain |
| Cost estimate | Subtract expected trading cost before deciding a tilt is worth making | Tilts whose edge is smaller than their friction |
| Concentration | Limit on any one factor, sector or stock | A momentum tilt becoming a single-sector bet |
| Volatility brake | Freeze changes when market volatility is extreme | Rebalancing into a disorderly market |
The sector limit is the one people forget. Factor portfolios drift into sectors without announcing it, because whatever has been rising lately is mostly in a few industries. Controlling sector exposure keeps the tilt a statement about the factor and not about whichever industry happened to lead. Position sizing and drawdown limits are covered in risk management.
Release lags, revisions and look-ahead bias
Look-ahead bias is the quiet way a rotation backtest becomes fiction. It enters in three places, and each one flatters the result.
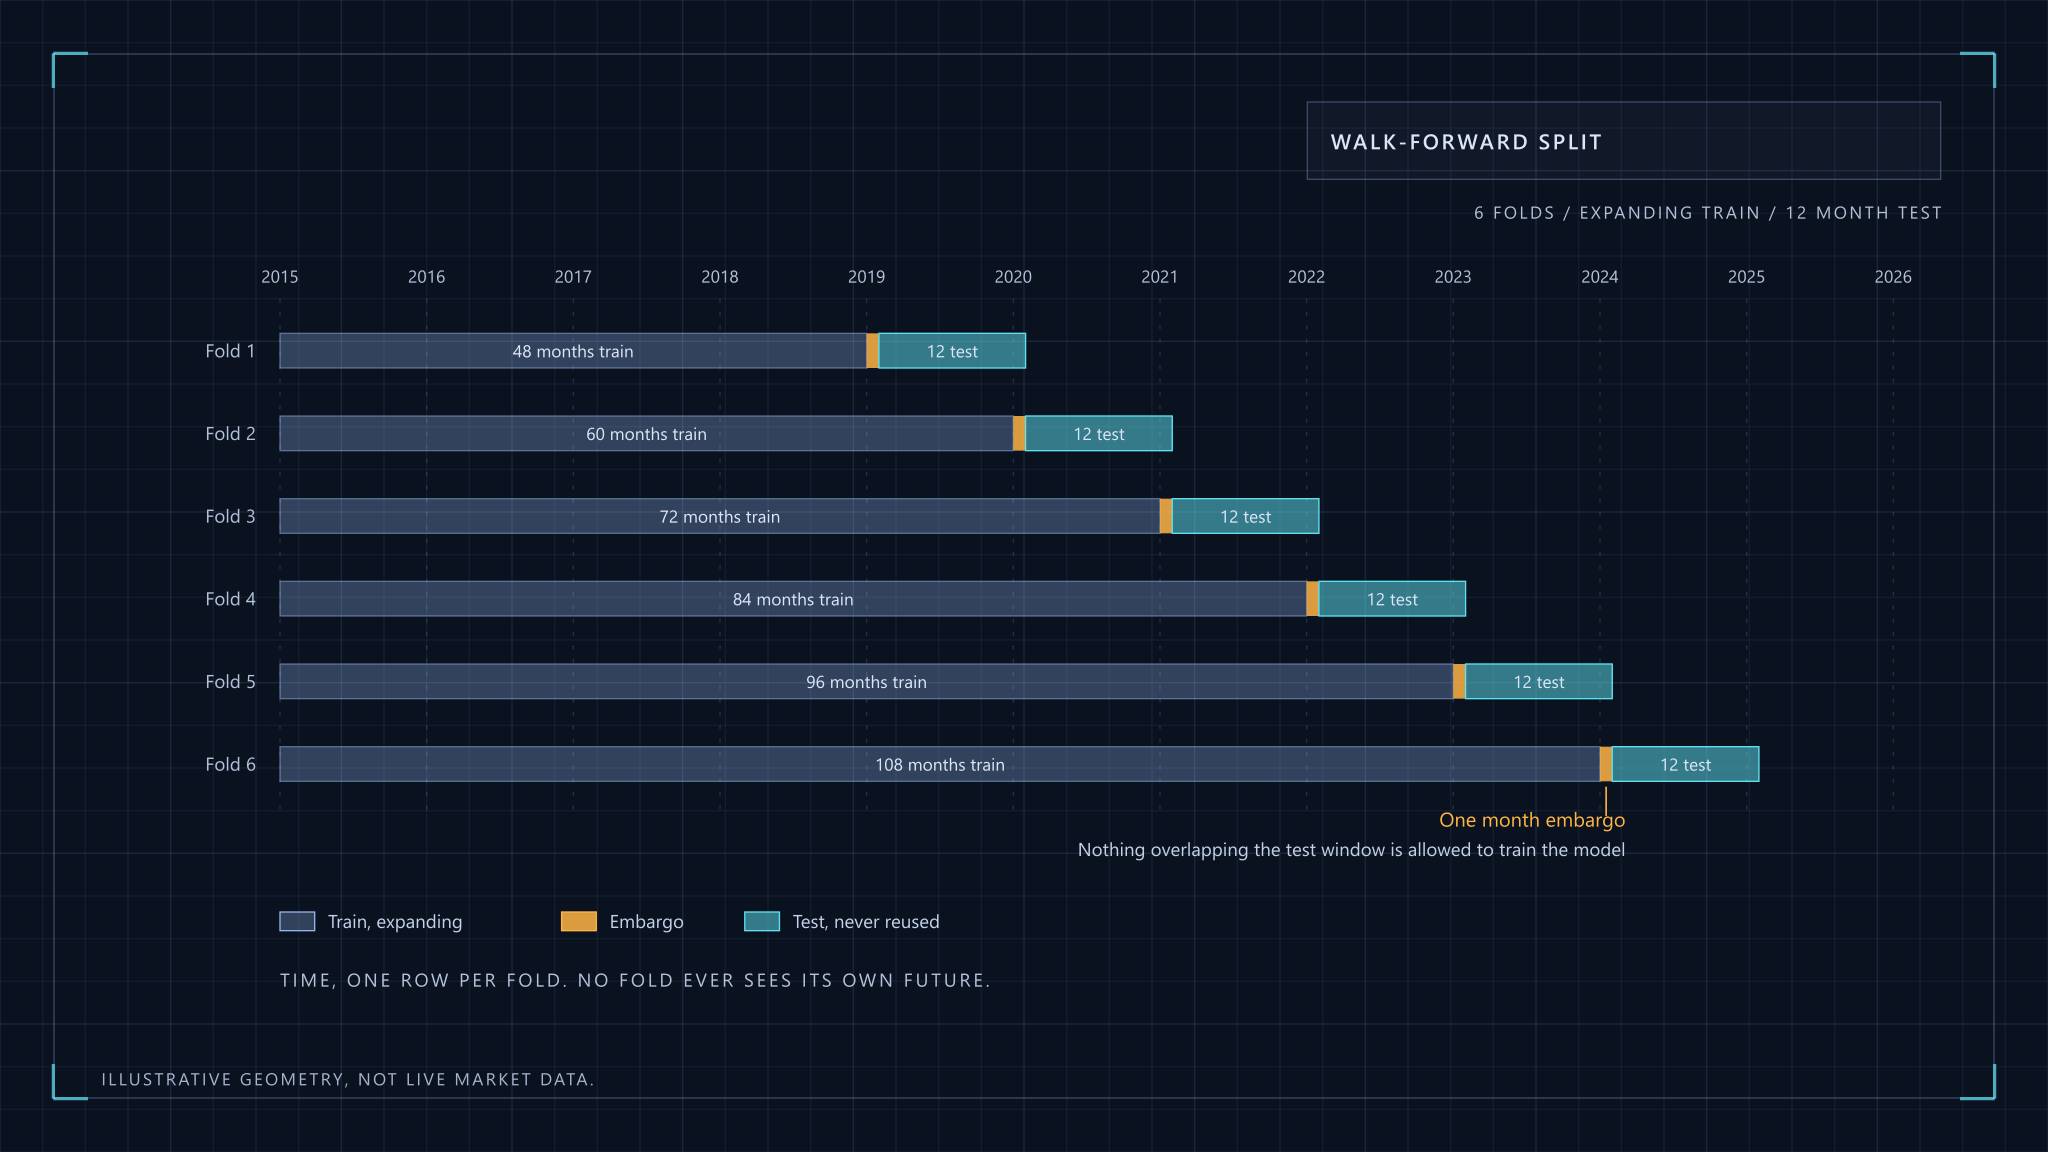
First, release lags. A monthly indicator describes a month that has already ended, and it is published days or weeks later. If a backtest acts on the March reading at the start of March, it is using information nobody had. Date every observation by when it was published, not by the period it describes. In the figure the tilt is applied one month after the score is known for exactly this reason.
Second, revisions. Many macro series are revised after first release, and a database that stores only the latest vintage hands you cleaned-up numbers that no one traded on. A PMI flash estimate, for instance, is built from a subset of survey responses and can differ from the final reading. Use real-time vintages where they exist, and where they do not, treat the backtest as an upper bound.
Third, the choices you make after seeing results. If you tried forty combinations of dials and thresholds and kept the best, the backtest has been fitted to the past. Count the combinations you tried and discount the result accordingly.
A practical routine is a calendar: fetch each release on its publication date, log the value with a timestamp, and let the rule read only what the log holds. It is dull, and it is what separates a test from a story.
Measuring whether rotation added anything
The comparison that matters is not rotation against the market. It is rotation against the static multi-factor blend you would hold without any macro view, with the same factors, the same weights on average and similar costs. Anything else credits the timing with what the factors earned on their own.
The cleanest summary is the information ratio of the active return over that static blend, which is the excess return divided by its volatility. Look at it net of costs, and on a rolling window, because a ratio that is excellent over the whole sample and negative over the last five years is telling you something.
Attribution then splits the result. How much came from the allocation choice, meaning which factor you favoured and when, and how much from selection inside each factor sleeve? If rotation is barely positive and selection is strongly positive, the macro overlay was not the source of the edge. That is worth knowing even though it is disappointing.
A last caution is sample size. A macro cycle lasts years, and a single economy has seen only a few complete ones. A hundred monthly observations sounds like plenty, but they are heavily autocorrelated, and the number of independent bets is closer to the number of regime changes than to the number of months. Treat a short, good record as weak evidence.
Why factor timing is widely considered hard
This is the section to read twice, because it is the strongest argument against everything above. Cliff Asness co-founded a firm that sells factor strategies and has every incentive to like timing. In 2016 he wrote "The Siren Song of Factor Timing". His verdict was that he finds such timing strategies very weak historically, and that the appeal should be resisted even if that is disappointing to some. He also notes a powerful incentive to oversell timing ability, since it would bring back skill-based active management and its fees.
The evidence is not entirely one way. Ilmanen, Israel, Moskowitz, Thapar and Lee examine a century of factor premia and find real variation in factor returns over time, with some predictability. As summarised, the predictability is modest and likely fails to survive implementation costs. That sits comfortably with the Asness view, and it is the position this article takes: the premia do vary, the signals are weak, and the costs are certain.
There are good reasons for it. Factor returns are noisy, so a good signal needs a long record to be told apart from luck. Macro variables are slow and revised. Everyone watches the same indicators, which compresses any edge. And the cost side is concrete while the benefit is statistical.
So why bother at all? Because the realistic version of this strategy is small. A cap of a few points around a diversified static blend cannot hurt much if the signal is useless and can help a little if it is not. The wrong version is large, concentrated and justified by a backtest. The first is a modest, rules-based tilt. The second is a bet dressed up as a process.
If you do run an overlay, a sensible default is to expect nothing, size it so that expecting nothing is acceptable, and keep it only if the net, out-of-sample record earns its place. The same caution applies to machine learning for stock selection, where flexible models fitted on few observations find patterns that are not there.
A worked example from published factor indices
The ideas above hold in any market, but an example makes them concrete, and India offers a tidy one. NSE Indices publishes rules-based factor indices, among them Nifty200 Momentum 30, alongside value, quality and low-volatility variants. According to its factsheet, the momentum index holds 30 stocks chosen by a normalised momentum score, weights them by free-float market capitalisation multiplied by that score, and rebalances semi-annually.
For a rotation study, those public methodology documents are the useful part. They fix the rebalance dates and selection rules, so the factor sleeves are reproducible and a backtest cannot quietly change what "momentum" means between periods. Pair them with RBI liquidity data and a published PMI series, apply the release-lag discipline above, and you have a testable question. Whether the answer is yes is a separate matter, and a fair test compares against the static blend of the same indices.
Value deserves a note of its own, since it depends on accounting data that arrives with a lag. Read fundamental analysis alongside any factor definition. The same structure works anywhere there is a published factor index and a macro calendar.
Where this leaves a practitioner
Hold a diversified factor blend. If a macro overlay appeals, keep it small, capped and cost-aware, date every input by its publication, and judge it against the static blend after costs.
If the overlay does not clearly beat that blend, drop it. That is not a failure of the research. It is the research working.
Macro-Driven Factor Rotation