An income portfolio is built to pay for something on a schedule, so the first question is how much cash it must produce and when, not how much yield it can show. Yield is easy to raise, and it is almost always raised by taking a risk that stays hidden until it gets expensive. This article treats income as a cash-flow problem with three linked costs: duration, credit and drawdown.
Every number below is an assumption, labelled as one. Where a rule from a particular country is a useful worked case, India's, it is flagged as an example, because the arithmetic belongs to any market.
Income is a cash-flow problem
Start with the liability, not the asset. Write down what the portfolio has to pay, in what amounts and in which months, in real terms if it will run for decades. Only then ask which holdings can cover it. A portfolio that yields 7 percent and falls 30 percent when you need the money has not solved the problem. It has moved it.
This changes what counts as a good holding. A bond that matures on the date a school fee falls due is worth more to that plan than a higher-yielding bond that matures in a year you do not care about. Matching dates is liability-driven thinking, and it is the opposite of ranking everything by yield and buying from the top.
The limit is that few people know their spending that precisely. A workable approximation is two buckets: money needed in the next two to three years, held in things that do not fall much, and money needed later, which can take volatility in exchange for growth. The split is a judgement. Revisit it when life changes, not when markets do.
What yield actually measures
Yield is a ratio, and either half of it can move. Income divided by price rises when the income rises, but also when the price falls. A yield that jumped from 5 to 9 percent in a quarter is far more often a price collapse than a pay rise, and the market usually knows something you have not read yet.
For a bond, the yield to maturity is the single rate that discounts every coupon and the redemption to today's price. It is a promise conditional on holding to maturity and on being repaid, and it quietly assumes each coupon can be reinvested at that same rate. For a share, the dividend yield is trailing: it describes what was paid, not what will be.
Three distinctions keep the number honest. Trailing yield is not forward yield. A distribution is not income, because a payout can include a return of the investor's own capital. And pre-tax is not after-tax, which matters more than most people expect and is dealt with below.
The trade between yield, duration and drawdown
You cannot raise yield for free. You pay in interest-rate sensitivity, credit risk or equity-like drawdown, usually in a mix. The useful habit is to name which of the three you are buying each time the yield goes up.
The figure below makes the trade visible with three illustrative sleeves: a short bond ladder, a sleeve of dividend-paying equity, and a sleeve of listed trusts that distribute most of their cash. Every blend in 10 percent steps is simulated, then plotted by portfolio yield against the worst drawdown seen over ten years.
Two things are worth taking from it. First, the edge is convex. Each step from ladder towards trusts adds the same 0.15 points of yield, but the first step costs 0.2 points of drawdown and the last costs 3.8. The early yield is cheap and the late yield is not. Second, the dividend equity sleeve sits far inside the edge. Judged only on yield against drawdown it is dominated, because its yield is low and its drawdown is large.
That second result is not an argument against owning equity. It is an argument against judging equity by this chart. Equity earns its place through growth in the payout and the price, which a single-period yield cannot see, and that comes back in the total return section below. The chart also flatters the ladder. With only volatility in the model there are no rate shocks and no defaults, so the true drawdown of a bond sleeve sits above what is drawn. The shape of the trade is reliable. The exact positions are not.
For the wider case that combining sleeves with different drivers beats picking the best one, see portfolio construction and diversification, which also explains why optimisers fed inputs like these give unstable answers.
Duration, and the reinvestment problem
Duration estimates how much a bond's price moves when yields move, and it is shorter than maturity whenever coupons are paid. Frederick Macaulay introduced it in his 1938 NBER study of interest rates and bond yields as the average time to receive the payments, weighted by their present value. Divide by one plus the yield and you get modified duration, the approximate percentage price change for a one-point move in yield.
A five-year bond with a 6.5 percent annual coupon priced at par has a Macaulay duration of about 4.4 years and a modified duration of about 4.2. A one-point rise in yield cuts its price by roughly 4.0 percent when repriced exactly, and the 4.2 figure is the first-order estimate of the same move. A ten-year bond on the same terms has a modified duration near 7.2, and the same one-point rise costs about 6.9 percent. Longer paper is paid for with larger swings.
Rate risk has a mirror image. If yields rise, the price of a bond you already own falls, but every coupon and maturity from here on reinvests at the new, higher rate. Held to maturity, the price loss reverses on its own and what remains is the higher income. If yields fall, the price rises but reinvestment gets harder. Which effect dominates depends on your horizon: a holder with a long horizon is hurt by falling yields, and a holder who must sell soon is hurt by rising ones.
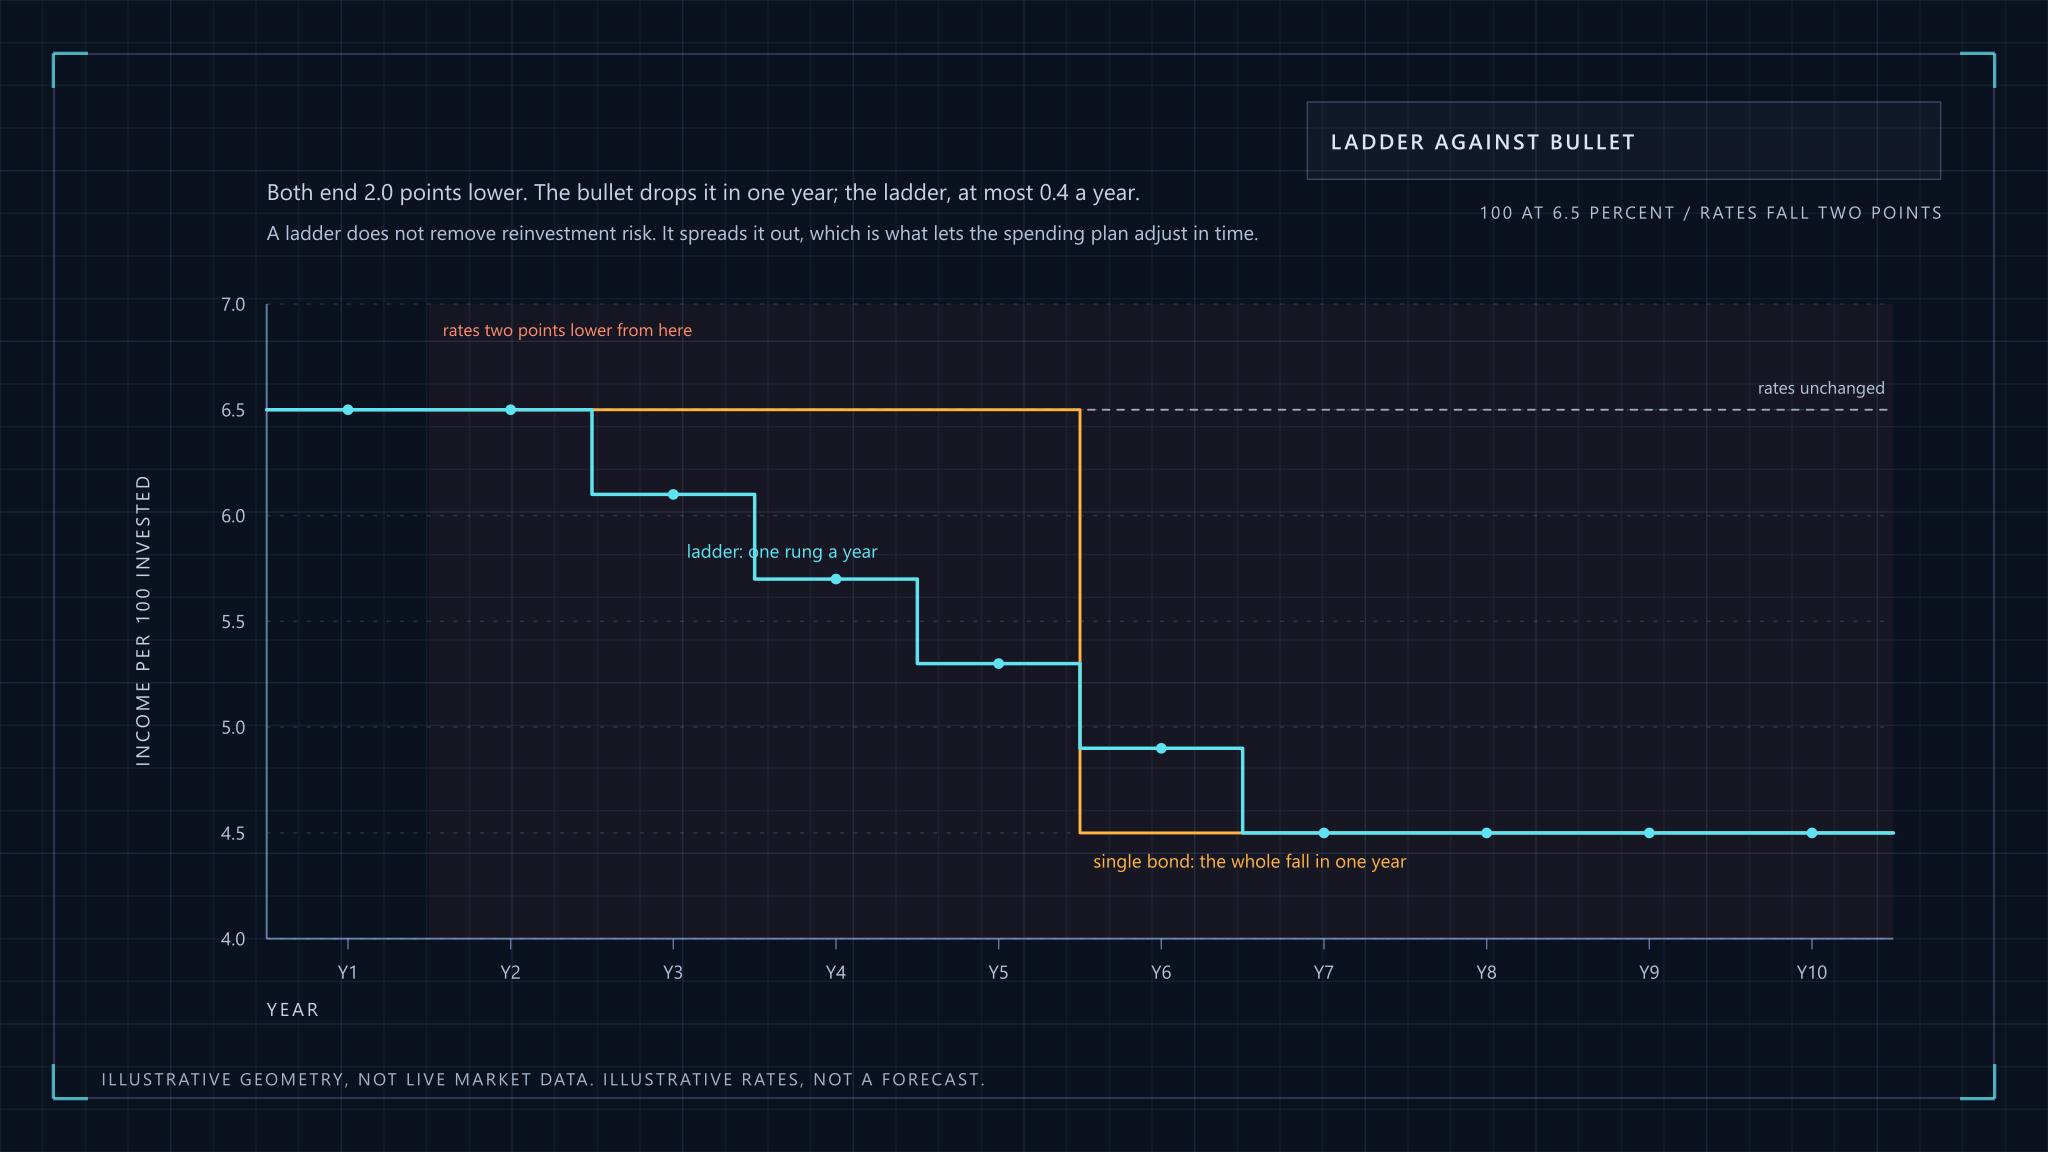
This is why a ladder is useful. Split the bond money into rungs maturing in successive years, and each year one rung comes due and rolls into the longest rung at current rates. In a five-rung ladder, a one-point rise in yields lifts the ladder's yield by only 0.2 points once the first rung has rolled, then 0.4, and so on, while the price damage on rungs held to maturity is never realised. You give up the chance to time rates and get a schedule that does not depend on guessing them.
Target-maturity funds are a packaged version of the same idea: a pooled bond portfolio wound down on a stated date. SEBI's 2017 circular categorised Indian mutual fund schemes, debt funds included, and the framework has been revised since, so read the current scheme documents rather than trusting a label. A fund is not a bond. It has no single maturity guaranteed to the unit holder, and what you receive on the target date is the pool's market value, not a par repayment.
Yield traps and sustainability screens
A yield trap is a payout the underlying cash flow cannot support. The warning sign is rarely the yield alone. It is the distance between what is paid and what is earned, and how long that gap can be financed.
Three tests do most of the work, applied in general terms to any dividend-paying business:
| Test | What it asks | Warning sign |
|---|---|---|
| Payout ratio | What share of earnings is paid out? | Above 100 percent, or rising while earnings fall |
| Coverage | How many times do earnings and free cash flow cover the payout? | Cover below about 1.5 times, or only in good years |
| Cash-flow cover | Is the payout met from operating cash, or from new borrowing and asset sales? | Debt rising to fund distributions |
None of these is a threshold you can apply mechanically. A stable utility-like business can sustain a higher payout ratio than a cyclical one, and a ratio looks fine right up to the quarter earnings collapse. Treat the screen as a way of asking better questions, and read the cash flow statement rather than the ratio. The fundamental analysis article walks through that statement.
One opinion, held firmly: a very high yield on a business with falling revenue is a reason to look harder, not a bargain. The market is rarely paying you to ignore a risk it has already priced.
Listed real-estate and infrastructure trusts
REITs and InvITs are listed trusts that own income-producing property or infrastructure and must pass most of their cash on. That distribution rule is what makes them income assets, and it is also why their prices respond to interest rates much as bonds do.
SEBI's board decision, when it framed the Indian regulations, set the template: a REIT shall distribute not less than 90 percent of its net distributable cash flows, at least half-yearly, and publicly offered InvITs follow the same rule (see the SEBI press release). The regulations have been amended repeatedly, including how the cash flow itself is calculated, so check the current text on the SEBI regulations page. Comparable listed structures exist in many countries under other names, and the analysis carries over.
For the portfolio, that structure gives a set of exposures unlike bonds or equity:
- Rent and toll or tariff income follows contracts, so it is steadier than dividends, but it carries vacancy, tenant concentration and, for infrastructure, regulatory and traffic risk.
- Debt is used heavily. Higher funding costs reduce distributable cash directly, so these trusts feel interest rates twice, once in the price and once in the payout.
- A distribution can mix interest, dividend, rental income and return of capital. The headline yield does not tell you how much of it is your own money coming back.
- Liquidity is thinner than in large-cap equity, and units can trade at a discount to the value of what they hold.
Because several trusts can share tenants or the same regulatory regime, the number of units held is a poor measure of diversification. Count independent income drivers, not tickers.
Stress-test the cash flow, not the price
Stress the income itself, with three shocks: a rate rise, a payout cut, and a drawdown that forces you to sell. A portfolio can survive every price fall on paper and still fail, because the failure is a shortfall of cash at a bad moment.
Take an illustrative portfolio of 100 units: 50 in the ladder yielding 6.5 percent, 30 in dividend equity yielding 3.0 and 20 in income trusts yielding 8.0. The income is 3.25 plus 0.9 plus 1.6, which is 5.75 a year, against a planned withdrawal of 5.5.
Now cut the equity dividends by 25 percent and the trust distributions by 20 percent. Income falls to about 5.2 and the plan is short by about 0.3 a year, roughly 5 percent of what it needs. The rate shock is gentler here, since it raises ladder income slowly. The third shock is the dangerous one. If the equity sleeve falls 40 percent in the same period and the shortfall has to be met by selling units, you sell low to fund a gap that a larger cash buffer would have closed. The cash need does not shrink because the price did.
The remedies are the ones the test suggests: a bucket of cash and short paper sized to cover the shortfall for a stated number of years, a ladder long enough to bridge a bad cycle, and withdrawals set so the stressed income still covers them. A withdrawal rate that works only in the base case is a forecast, not a plan.
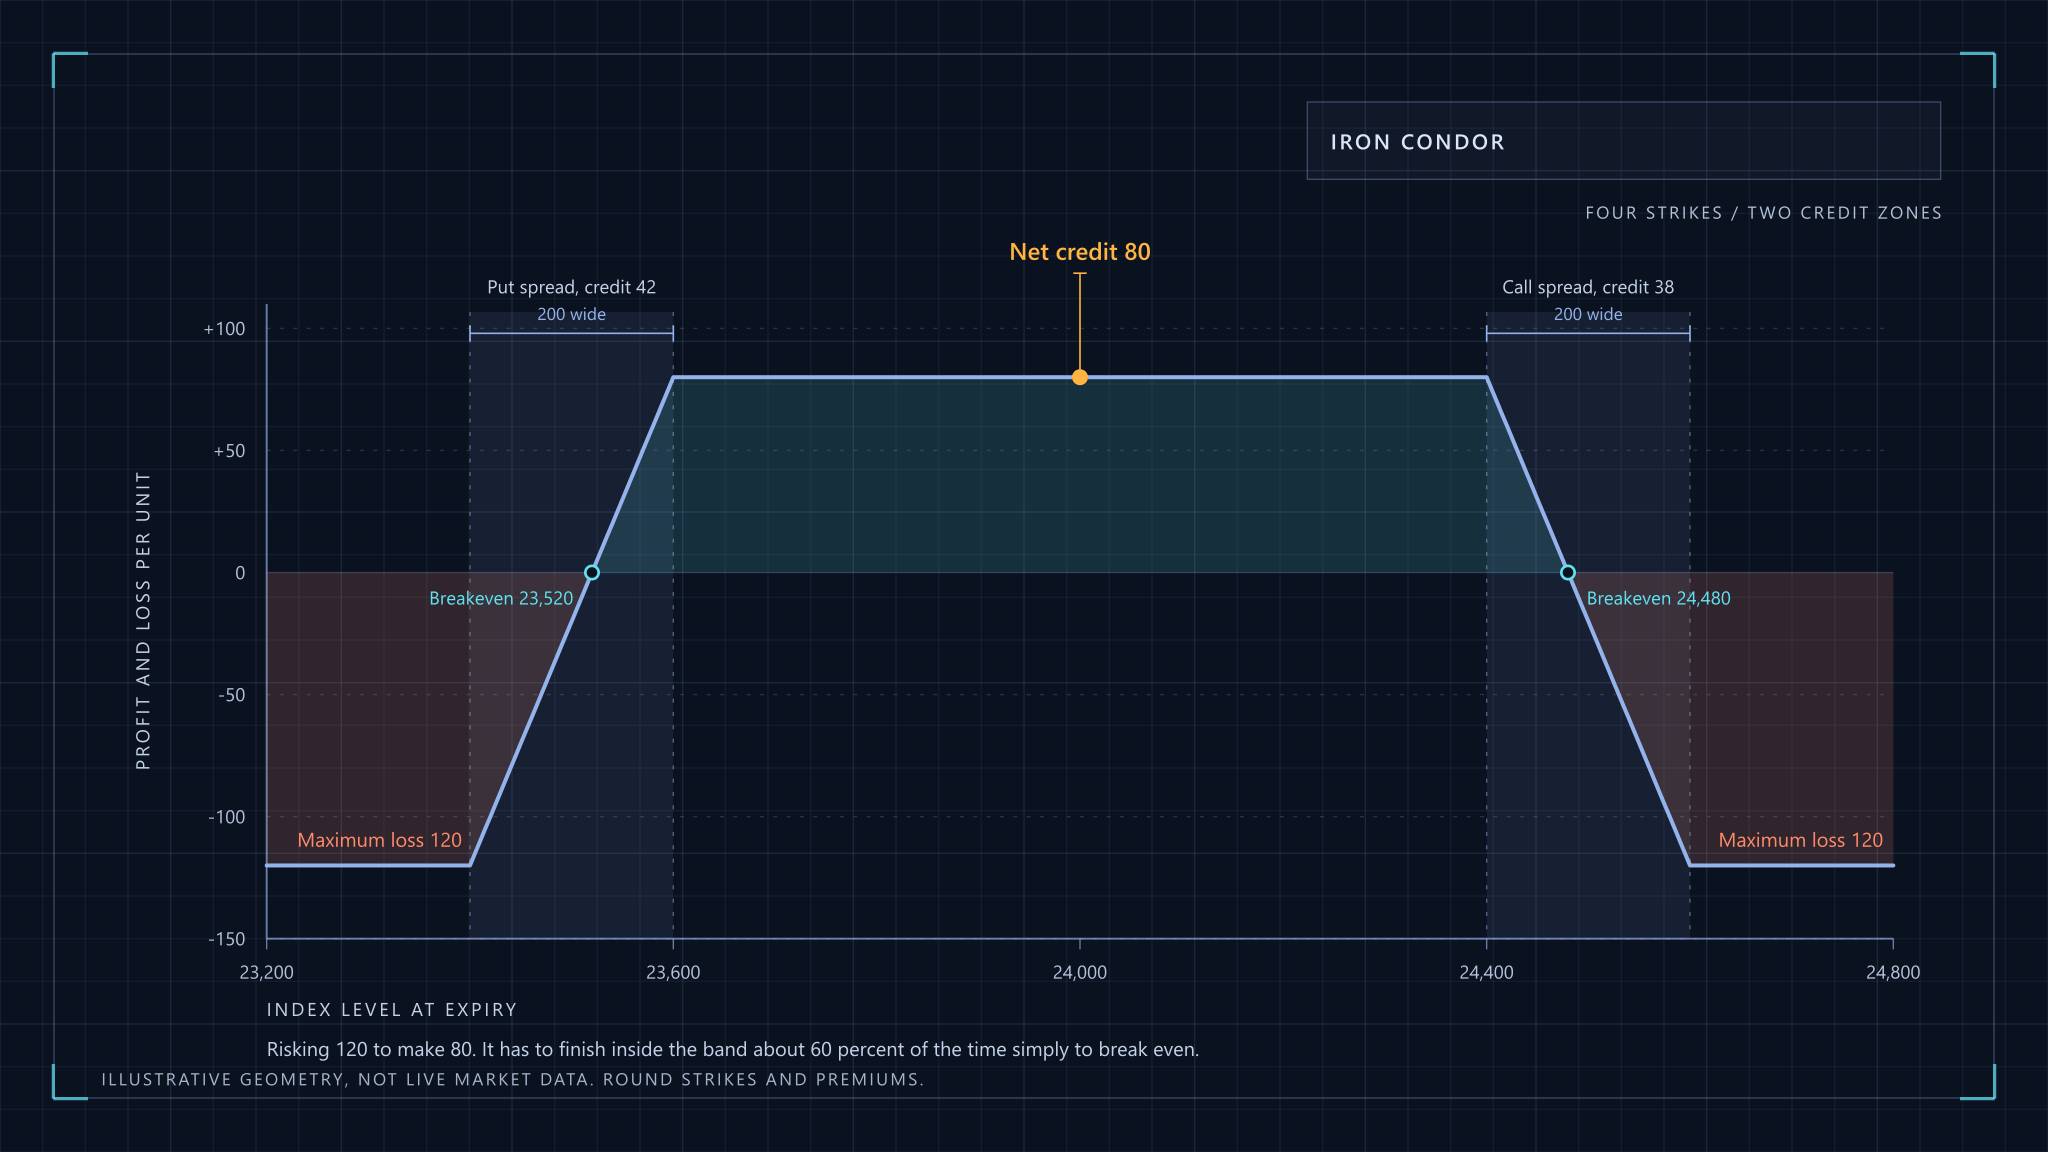
How to size positions and think about the tail more generally is covered in risk management. Option-selling is another route to income with a different risk profile, discussed in credit spreads and iron condors, and it should not be treated as a bond substitute.
Tax changes the number you actually receive
After-tax yield is pre-tax yield times one minus your marginal rate, and the treatment of each source can differ. Comparing a bond coupon, a dividend and a trust distribution on pre-tax yield alone is a category error.
One dated example, with the rate assumed rather than quoted. As of 31 October 2026, India's Income-tax Act, 2025 has been in force since 1 April 2026, replacing the 1961 Act, as the CBDT press release announced. Interest on a bond is generally added to an individual's income and taxed at the slab that applies to that individual. Take an assumed marginal rate of 30 percent, ignoring surcharge and cess: a 6.5 percent coupon becomes 4.55 percent after tax, and an 8.0 percent distribution that is fully taxable as income becomes 5.6.
That 30 percent is a stand-in for a high-income taxpayer, not a statement of current rates, and rates, slabs and the treatment of each component have changed several times in recent years. Do not take the rate from here. Take the mechanism: tax can remove nearly a third of a fully taxable yield, and a part of a trust distribution that is a return of capital is not income at all but lowers the cost base instead. Check the current rules on the Income Tax Department site before running your own numbers.
Total return, income, and what spending the yield costs
Spending only the yield does not protect your wealth, because the capital underneath still has to keep up with inflation. Income and total return are two views of one portfolio, and an income-only rule can quietly consume the real value of the base.
Suppose a portfolio pays out 5.75 percent a year while its capital value grows 1.5 percent a year and inflation runs at 4.5 percent. The nominal capital is rising, so the statement looks healthy. In real terms it shrinks by about 2.9 percent a year, to 75 percent of its starting value after ten years and 56 percent after twenty. Income that tracks the capital grows at 1.5 percent against 4.5 percent inflation, so the real spending power of the stream erodes at the same pace.
This is the reason to hold some assets chosen for growth in the payout, even though they look weak on the yield-and-drawdown chart. Dividend growth and capital growth together are what keep real income level. It is also why a plain bond ladder suits a time-limited liability and is a poor lifetime income plan on its own.
The competing view, a total-return approach, spends from both income and sales on a rule set in advance. It handles inflation better and makes the plan less dependent on any single payout. Its cost is that it requires selling in bad markets, which is exactly where the cash buffer from the stress test earns its keep. Neither approach is free. The question is which cost you would rather pay, and whether you wrote the rule down before the bad year arrived.
Where this model stops
The blend in the chart rests on mean-variance logic, set out in Markowitz's original paper, Portfolio Selection (Journal of Finance, 1952), and it inherits that framework's weakness: every input is an assumption, and the output moves with them. Push the equity and trust correlation from 0.6 towards 1 and the diversification between them shrinks, by construction. Treat the chart as a way of thinking, not an answer.
What it cannot capture matters more than what it can. Credit events, a trust cutting distributions after a tenant leaves, a forced sale into a thin market and a change in tax law are all lumpy, and none is normally distributed. A plan that survives them by design, with dated liabilities, a cash buffer and sources of income that fail for different reasons, is sturdier than one tuned to a simulation.
This article is educational and is not investment advice. It does not recommend any security, fund or trust. The author is not a SEBI-registered Research Analyst or Investment Adviser. All figures are illustrative assumptions, not market data, and past behaviour of any asset does not predict its future. Tax law changes, so verify rates and rules with the official source.
Income Portfolio Construction