Quantitative Analysis
Statistical Arbitrage and Pairs Trading
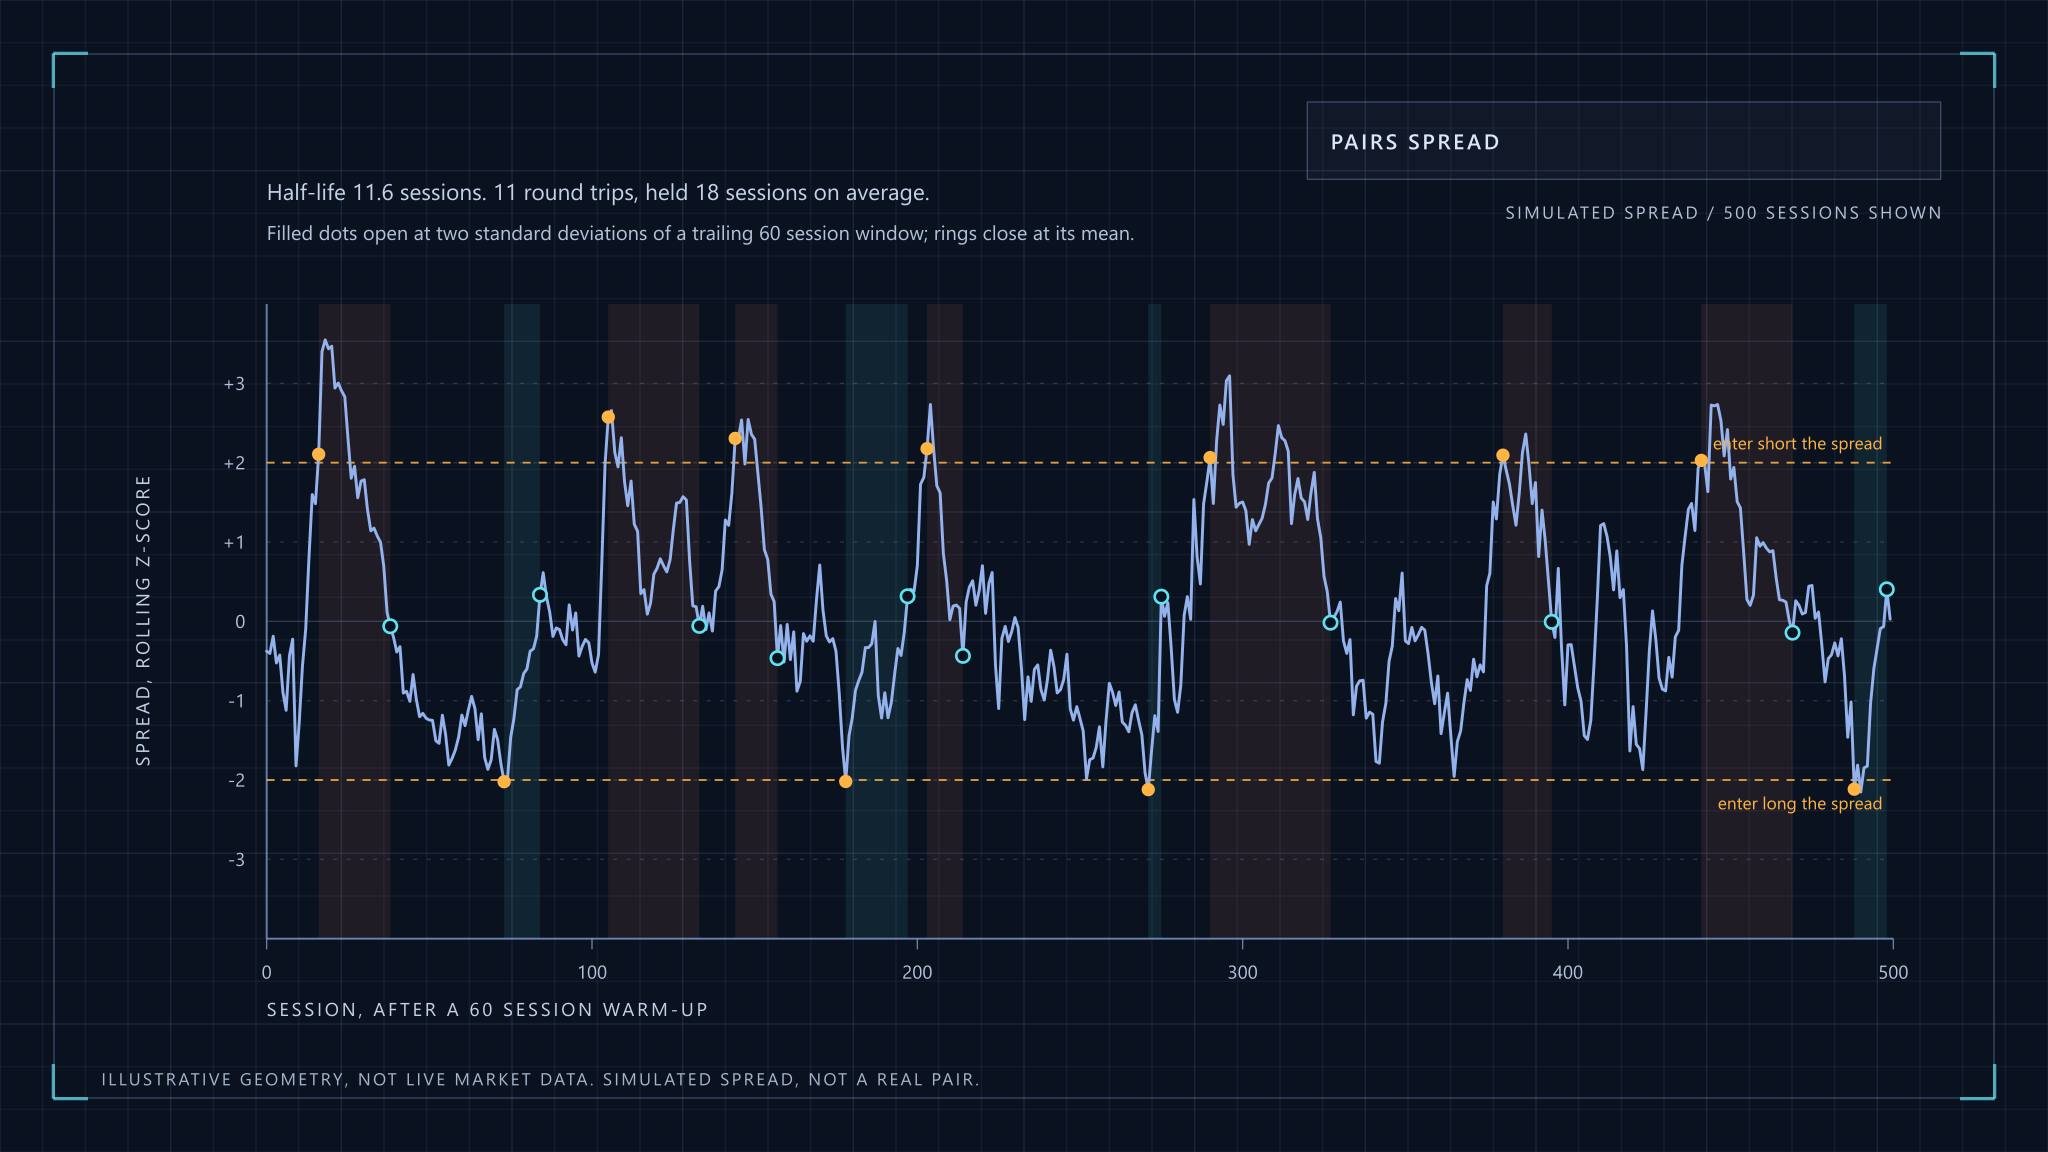
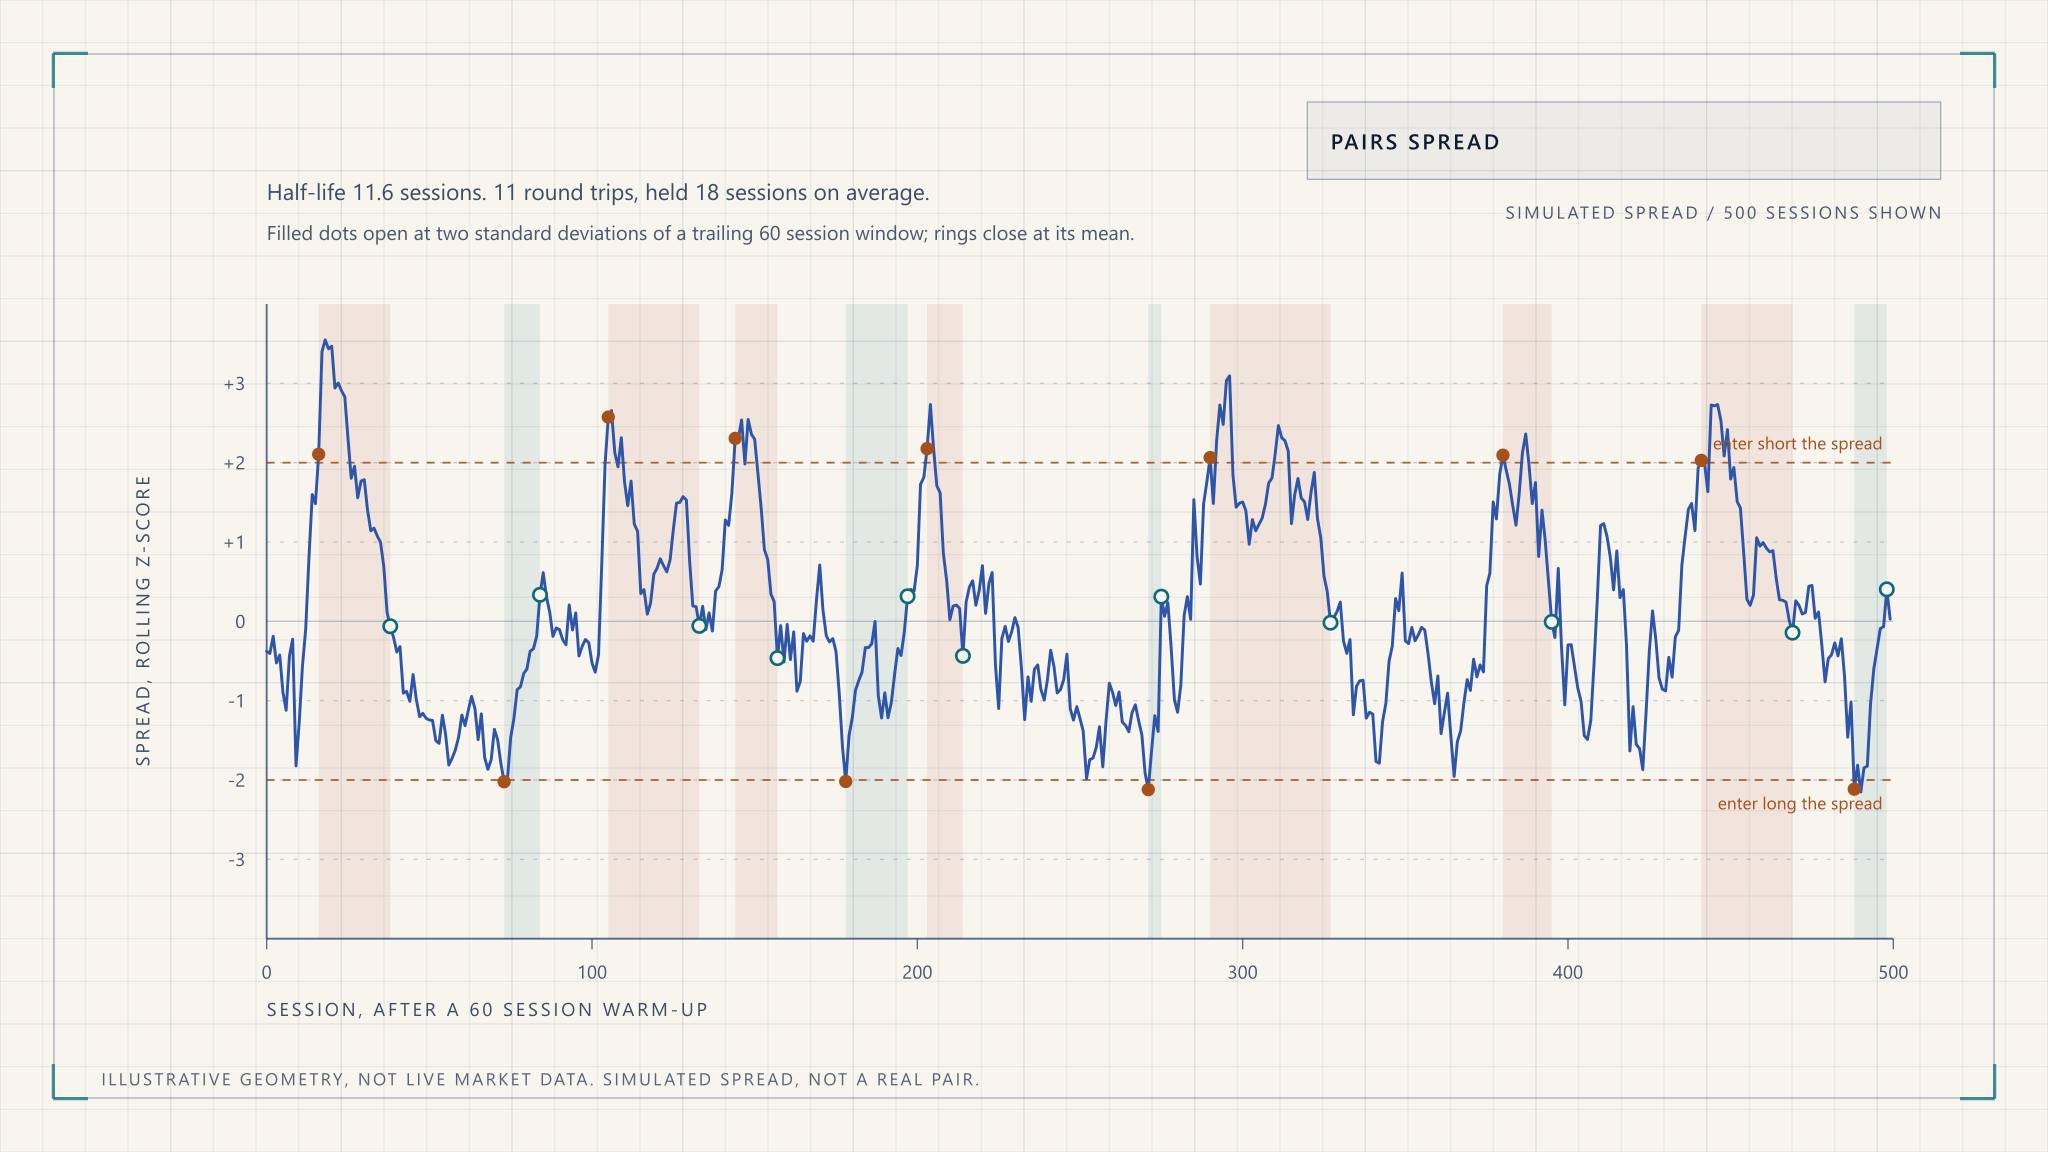
How pairs trading works, why cointegration beats correlation, how half-life and z-score thresholds set the trade, and why costs and breaks decide the result.
02 The complete index
Every entry is a complete treatment: the working shown, the assumptions named, and the failure modes left in rather than tidied away. Indian market data turns up often as a worked example because it is unusually well documented, but the method is the subject, and the method travels.
01 Browse by subject
Analysis first, then the option structures, then what you do with a portfolio once you have both. Start with whichever row is the question in front of you.
Row 01 Reading the data
Quantitative Analysis
How pairs trading works, why cointegration beats correlation, how half-life and z-score thresholds set the trade, and why costs and breaks decide the result.
Quantitative Analysis
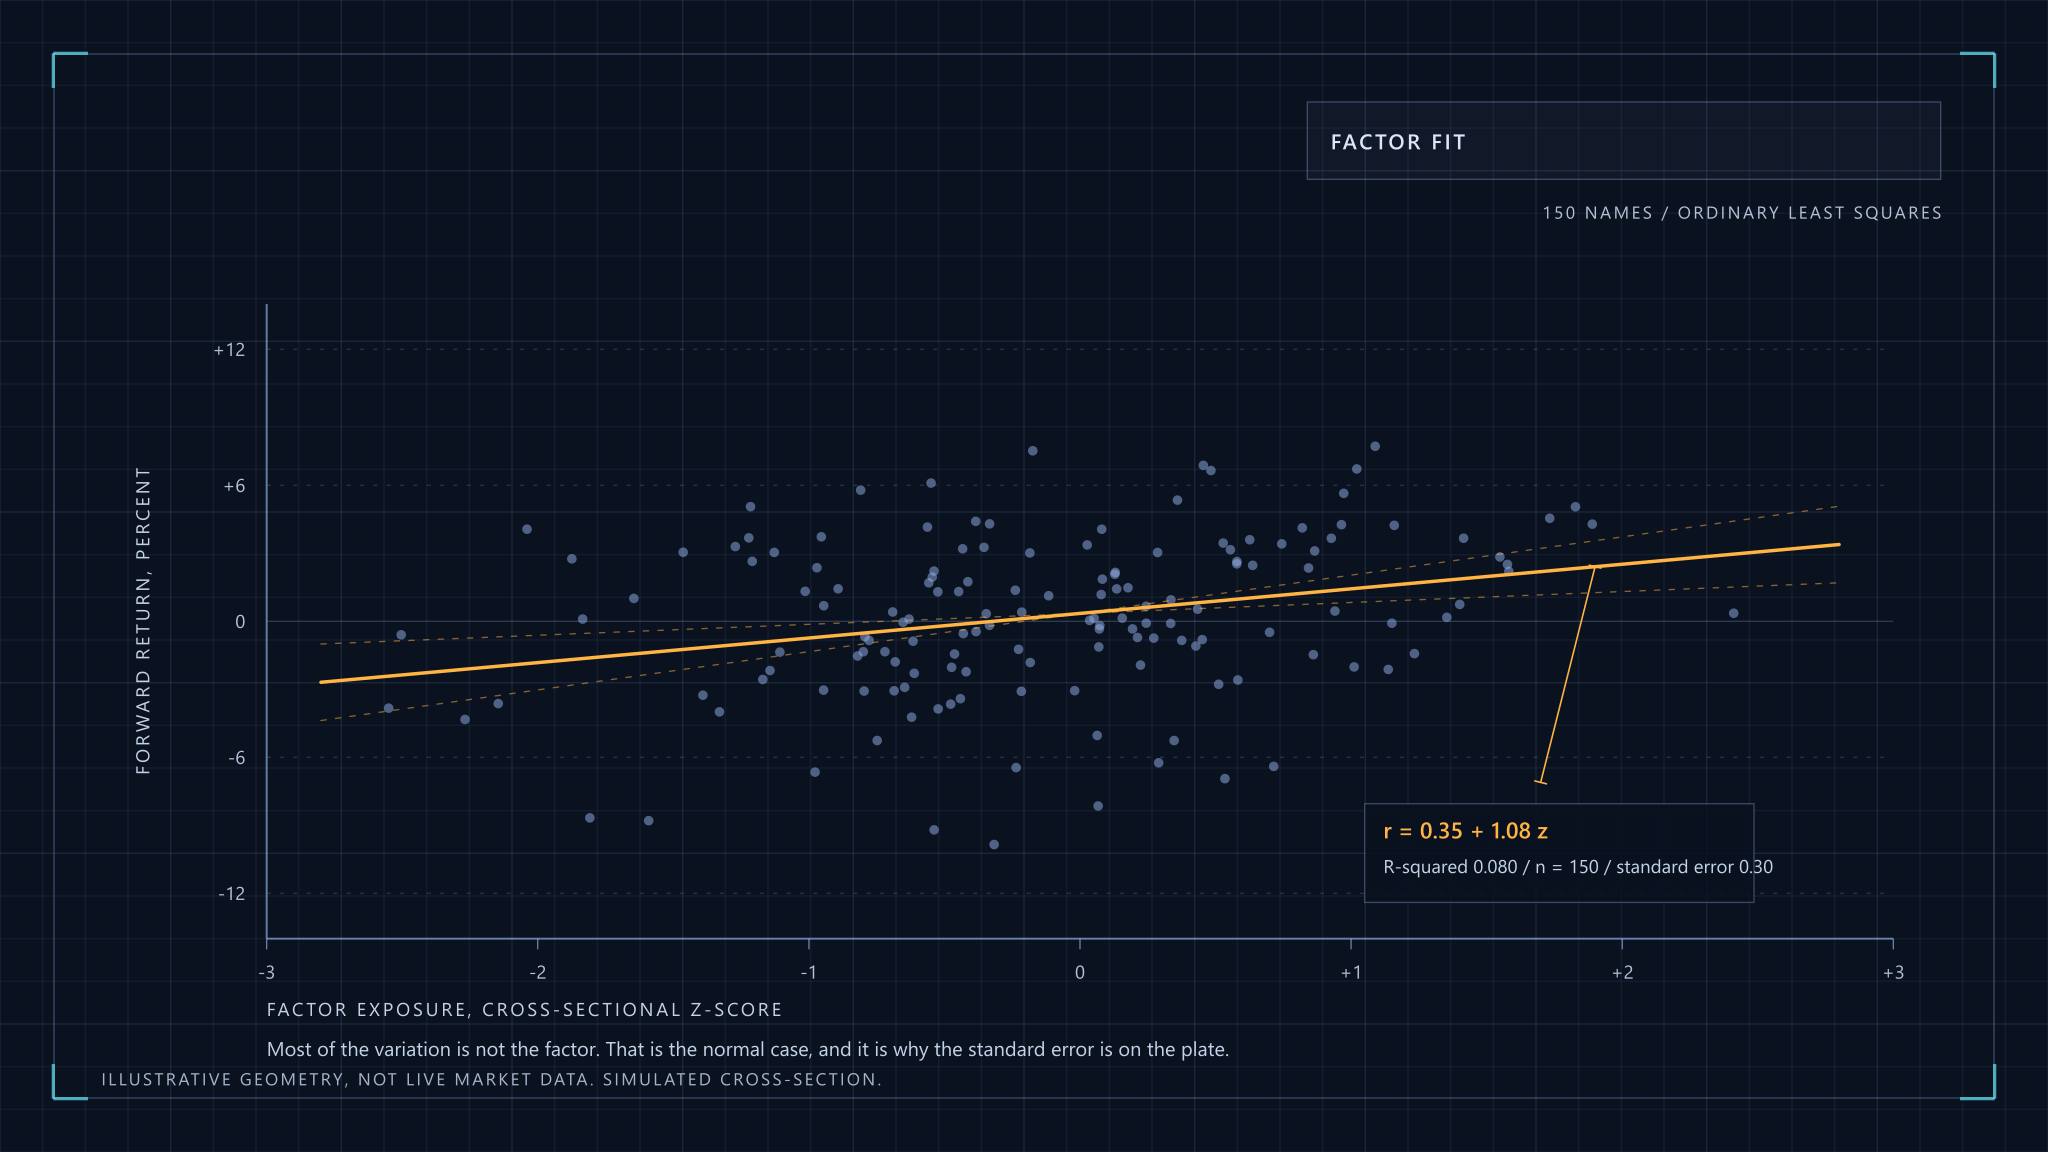
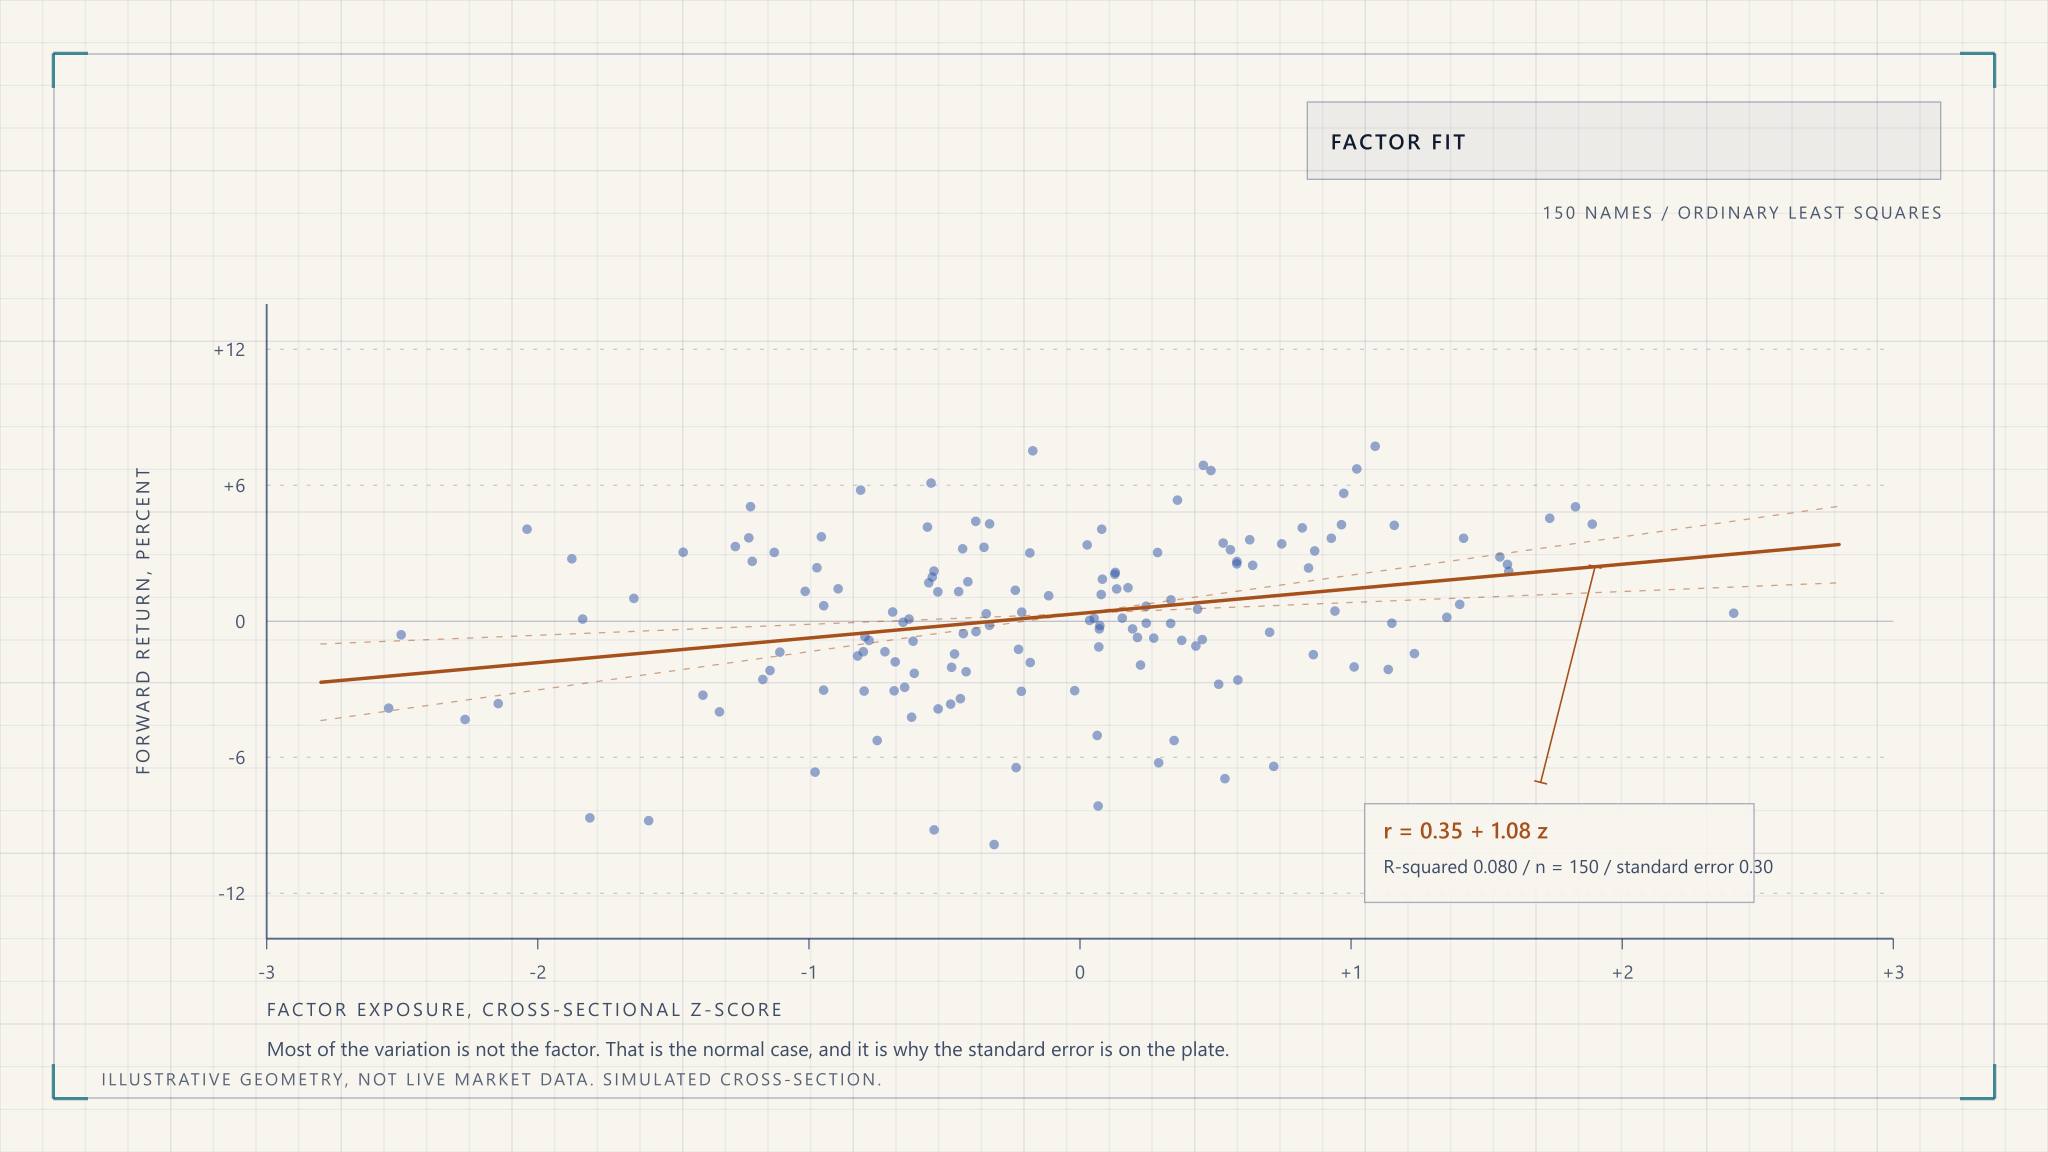
How quantitative analysis works: handling market data properly, the statistics that earn their place, factor models, and the four ways a backtest lies to you.
Technical Analysis
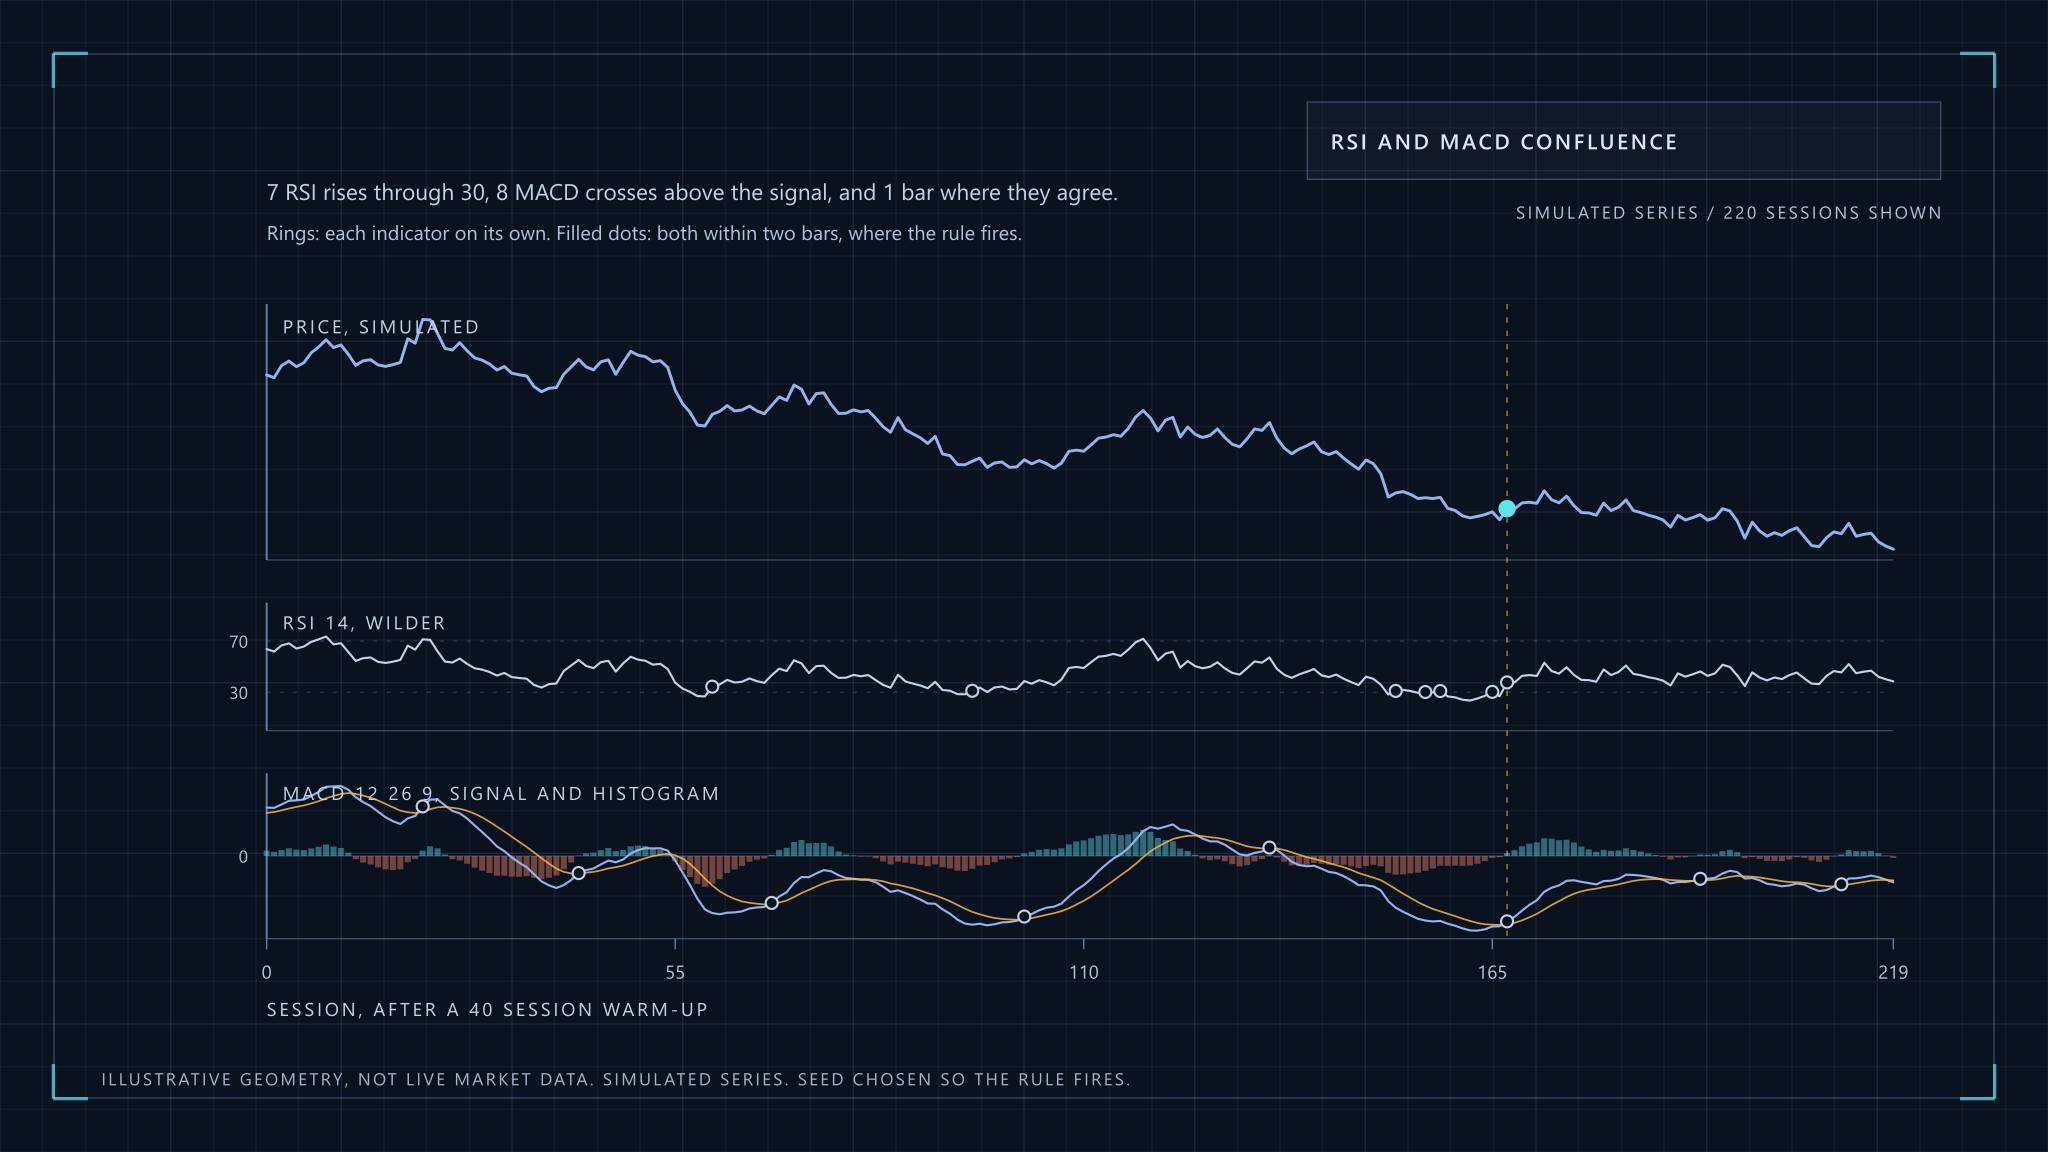
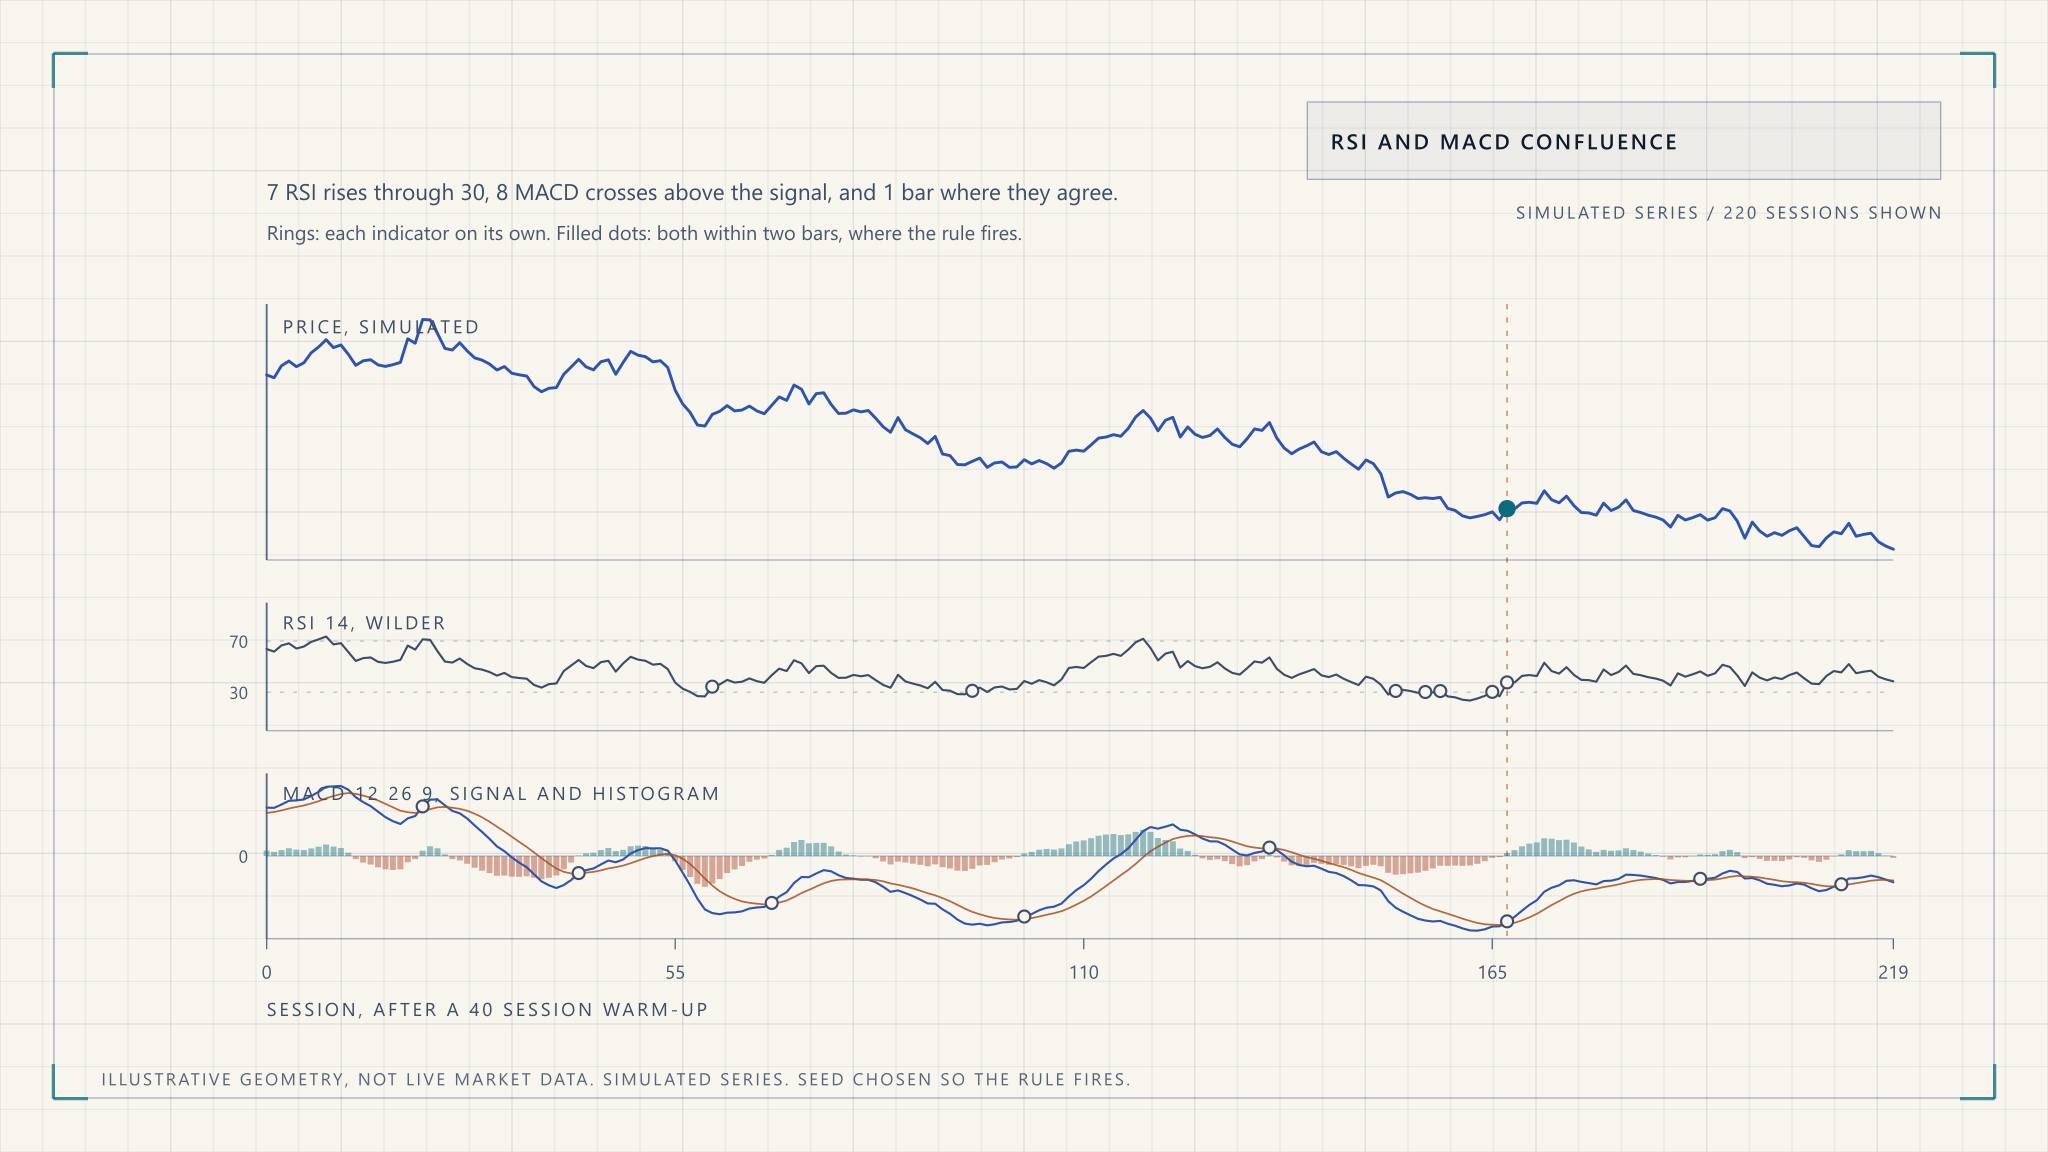
How RSI and MACD are computed, what combining them can and cannot add, and how to test a confluence rule against overfitting, costs and data snooping.
Technical Analysis
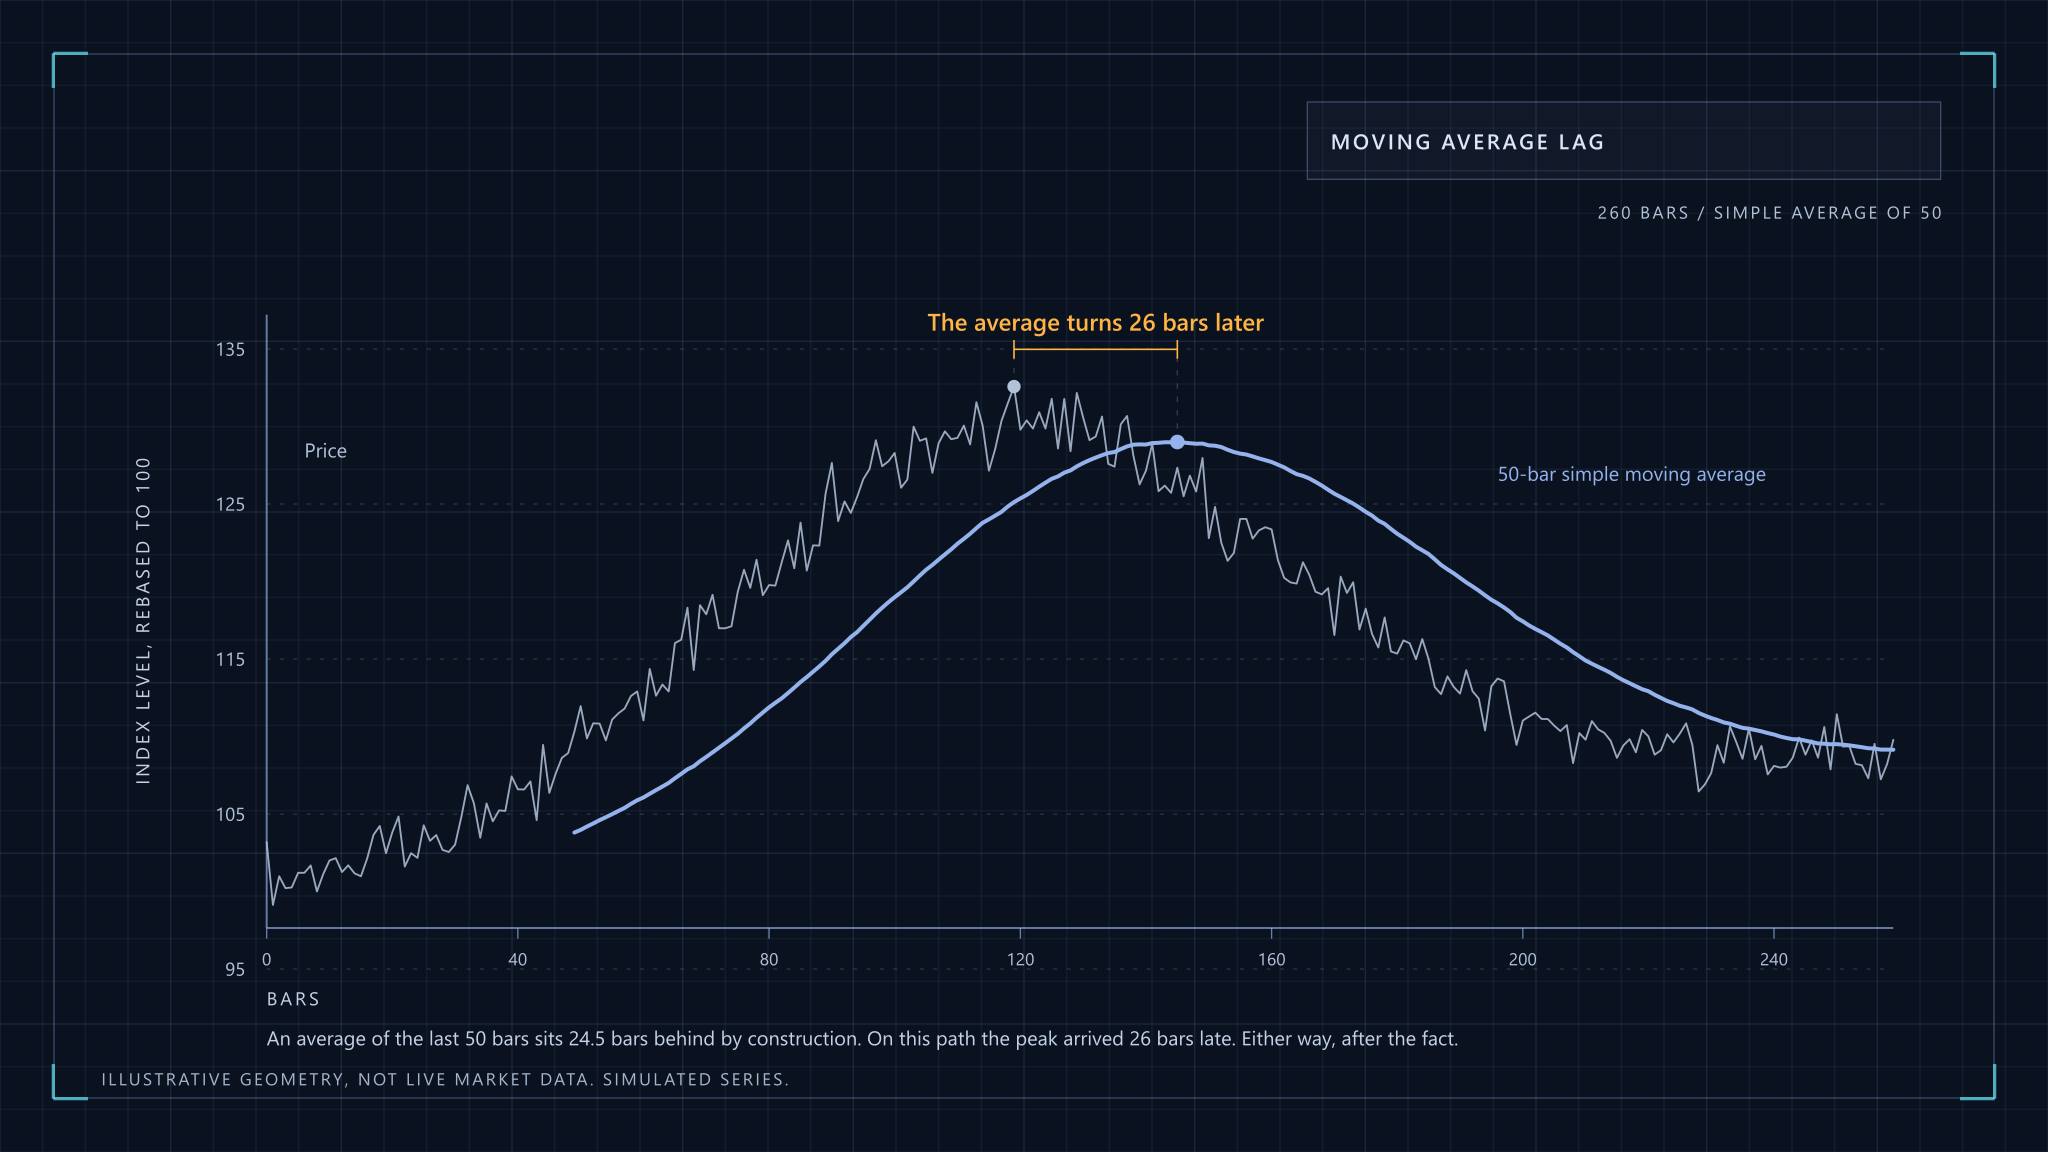
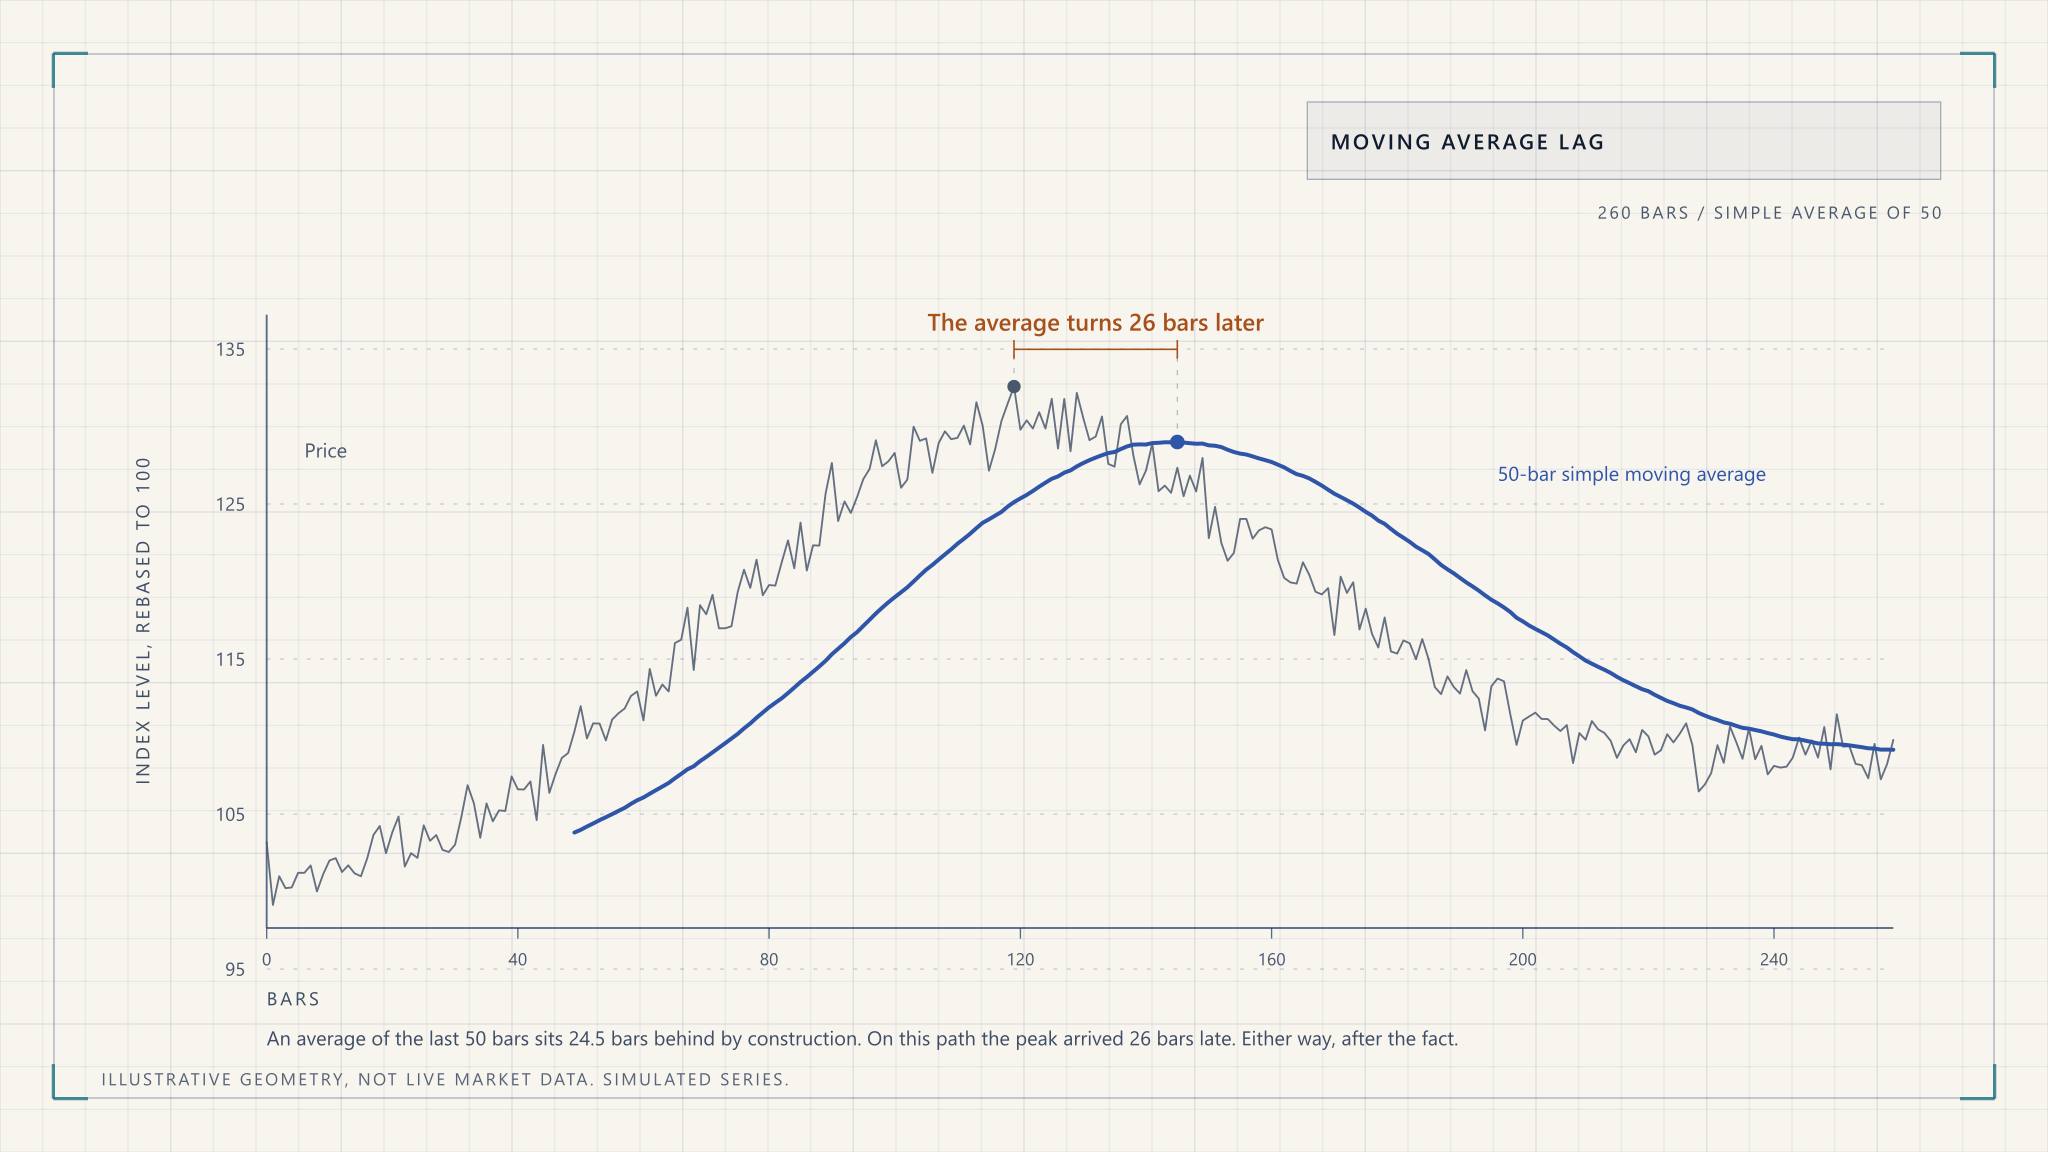
Technical analysis explained honestly: what the charts actually show, which claims survive testing, and how to check whether an indicator works at all.
Fundamental Analysis
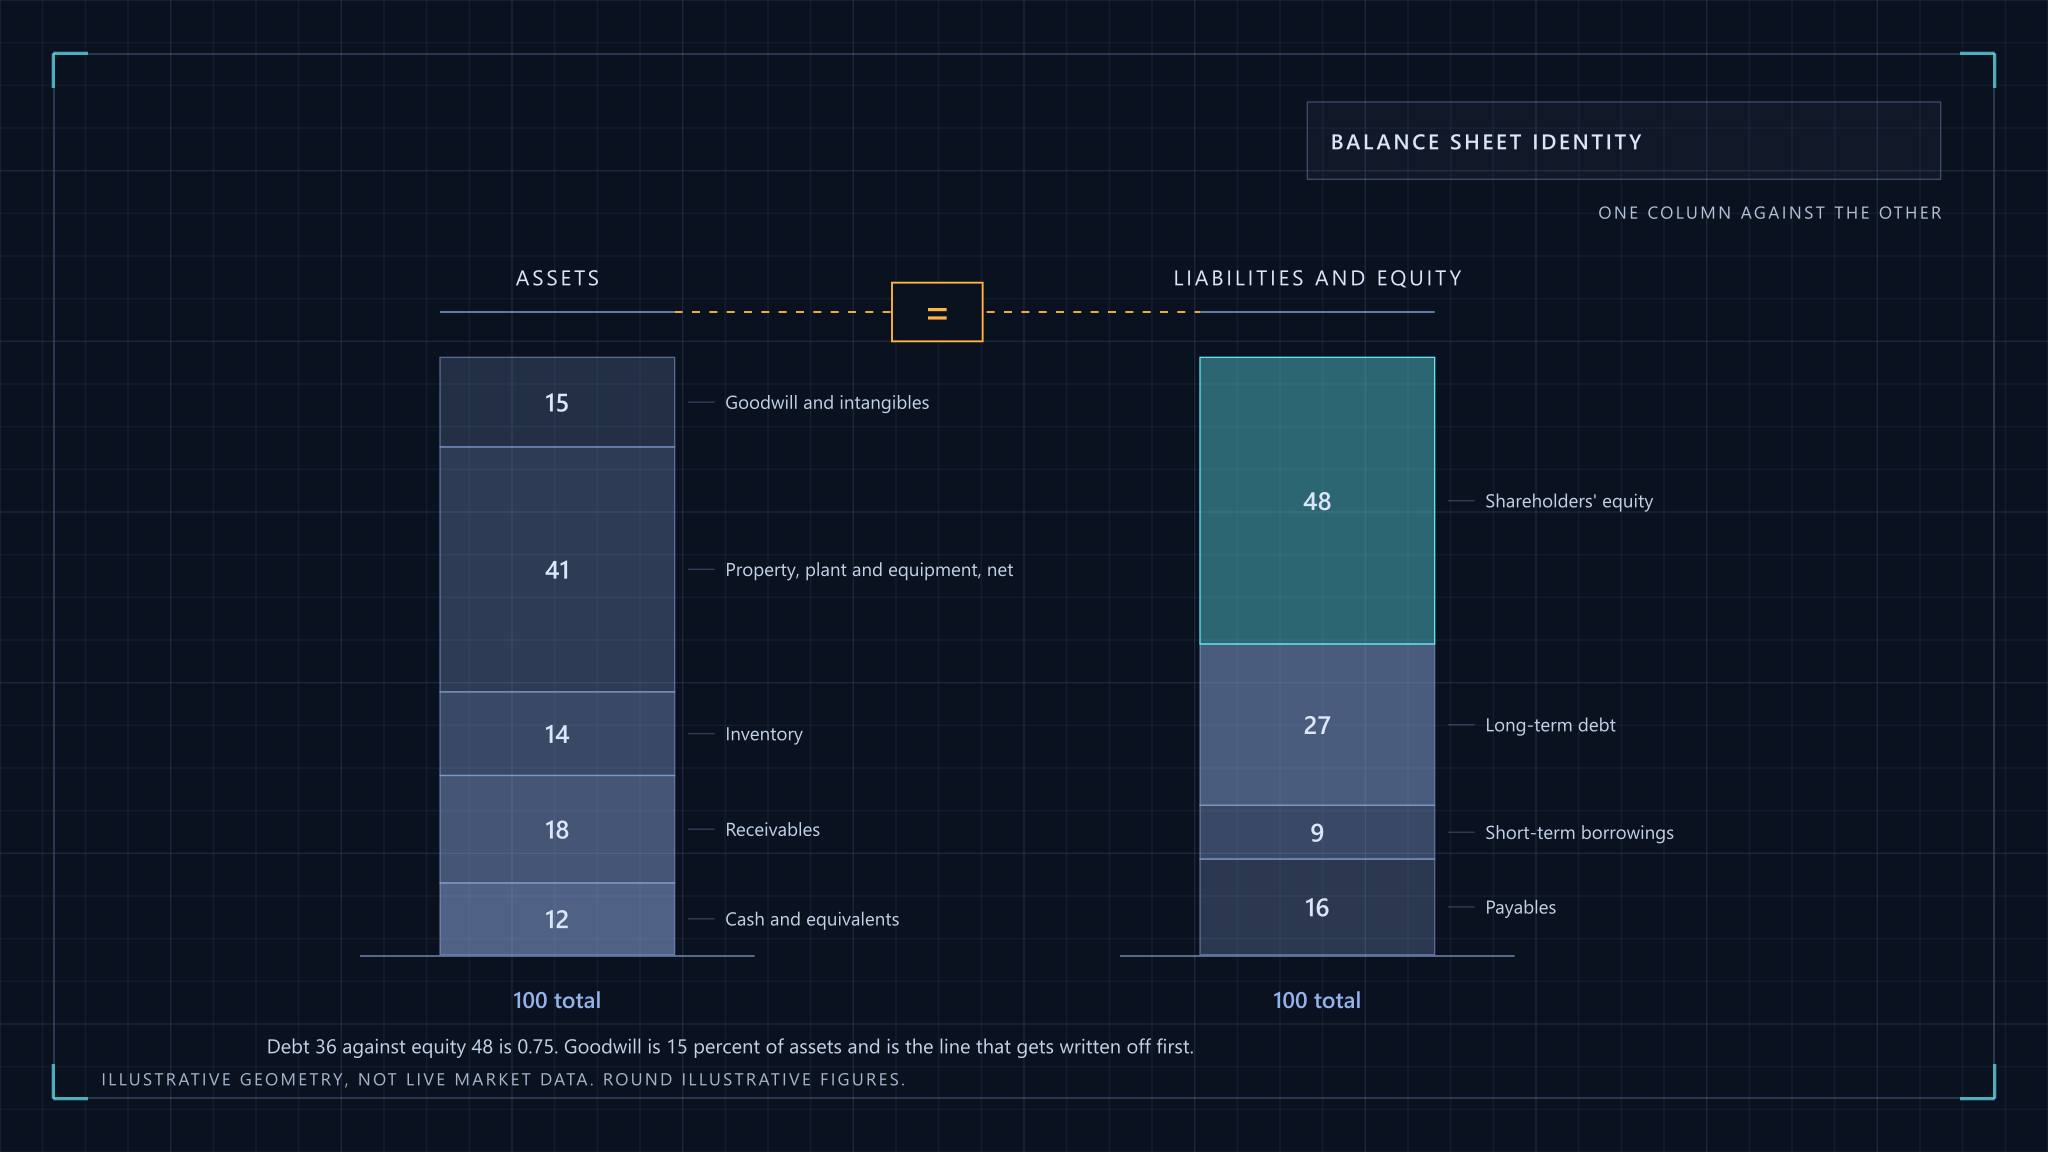
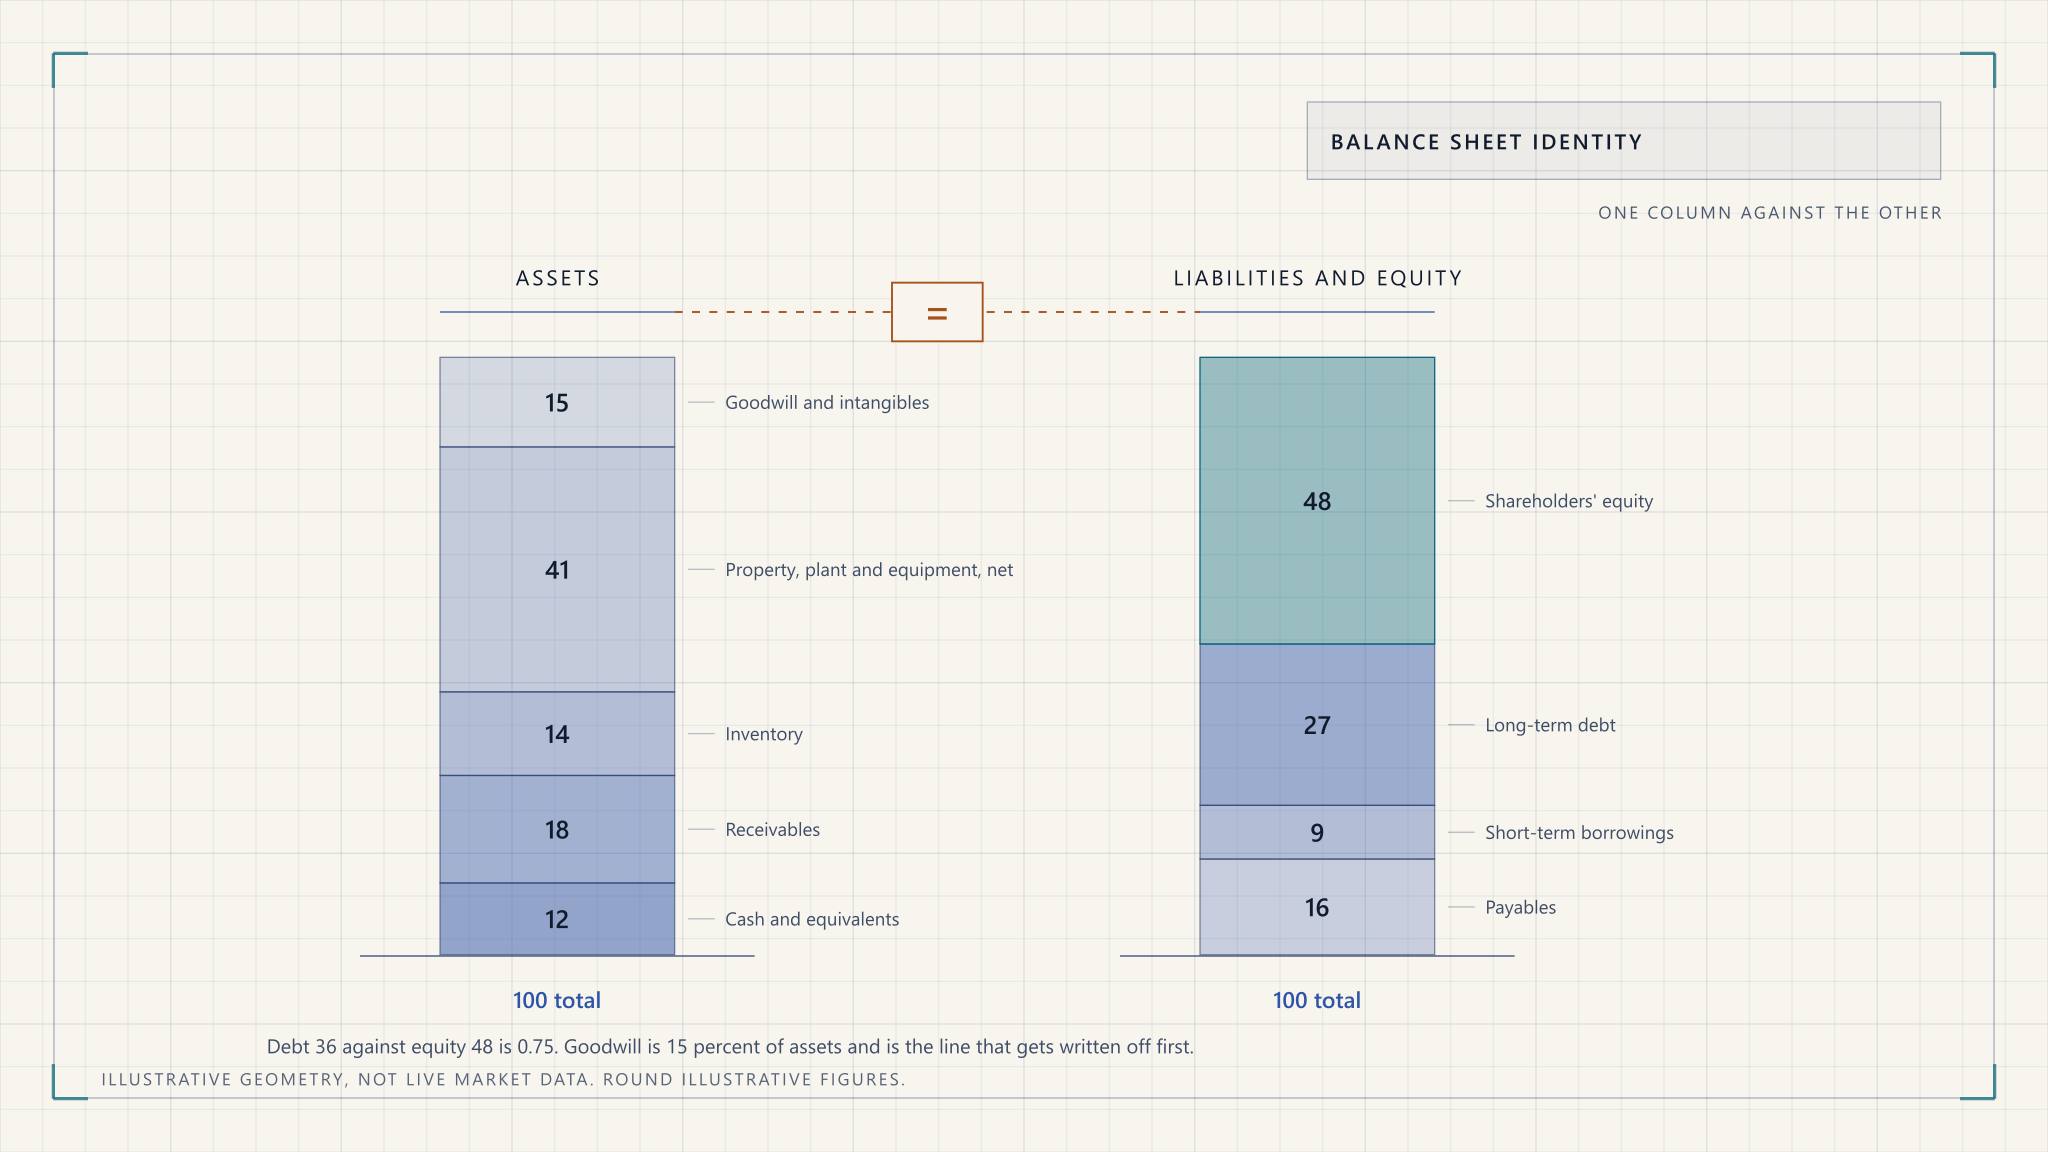
Fundamental analysis in practice: which financial statement to trust, what the ratios really answer, and the governance red flags that precede most failures.
Row 02 The option structures
Options & Trading
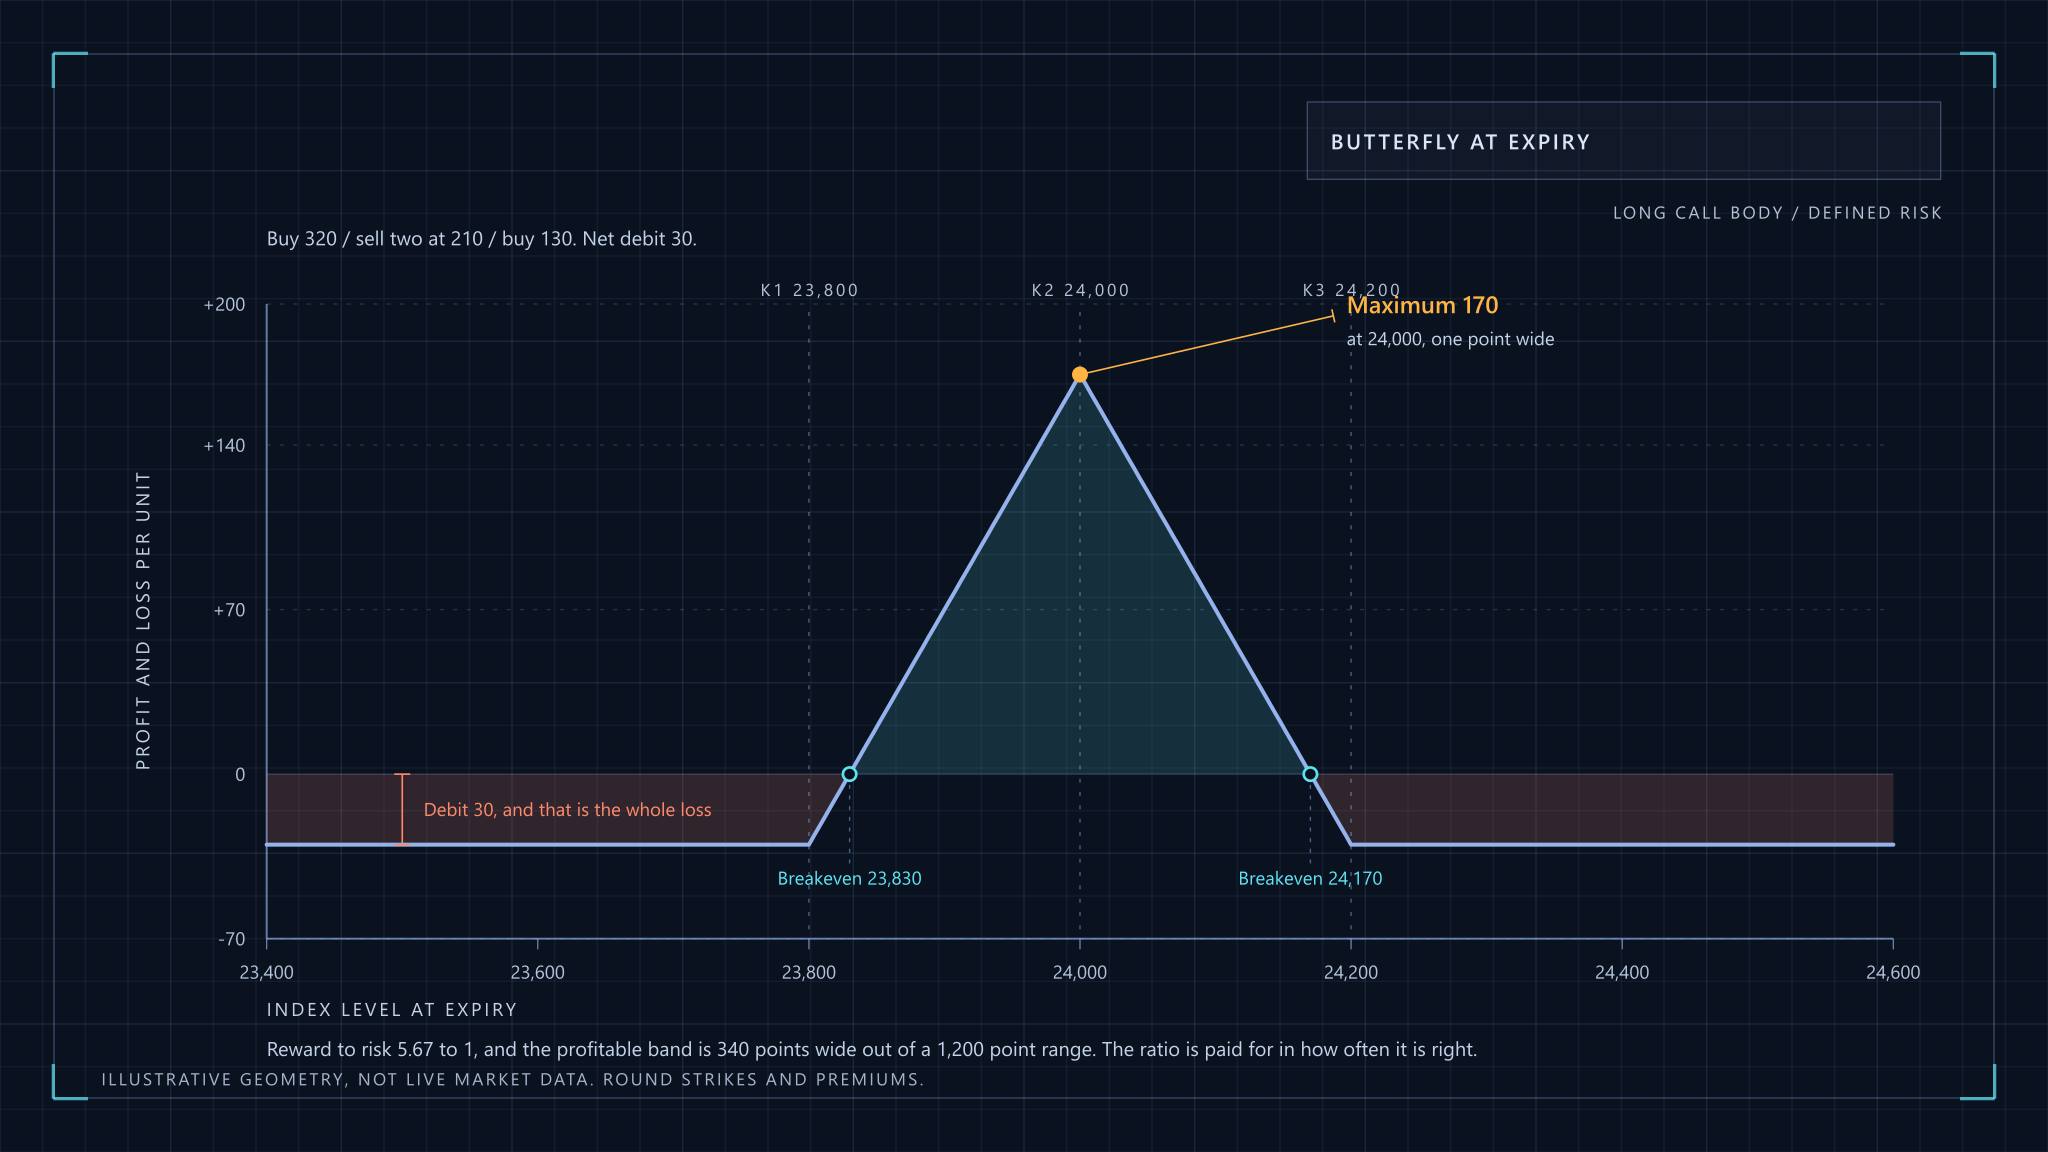
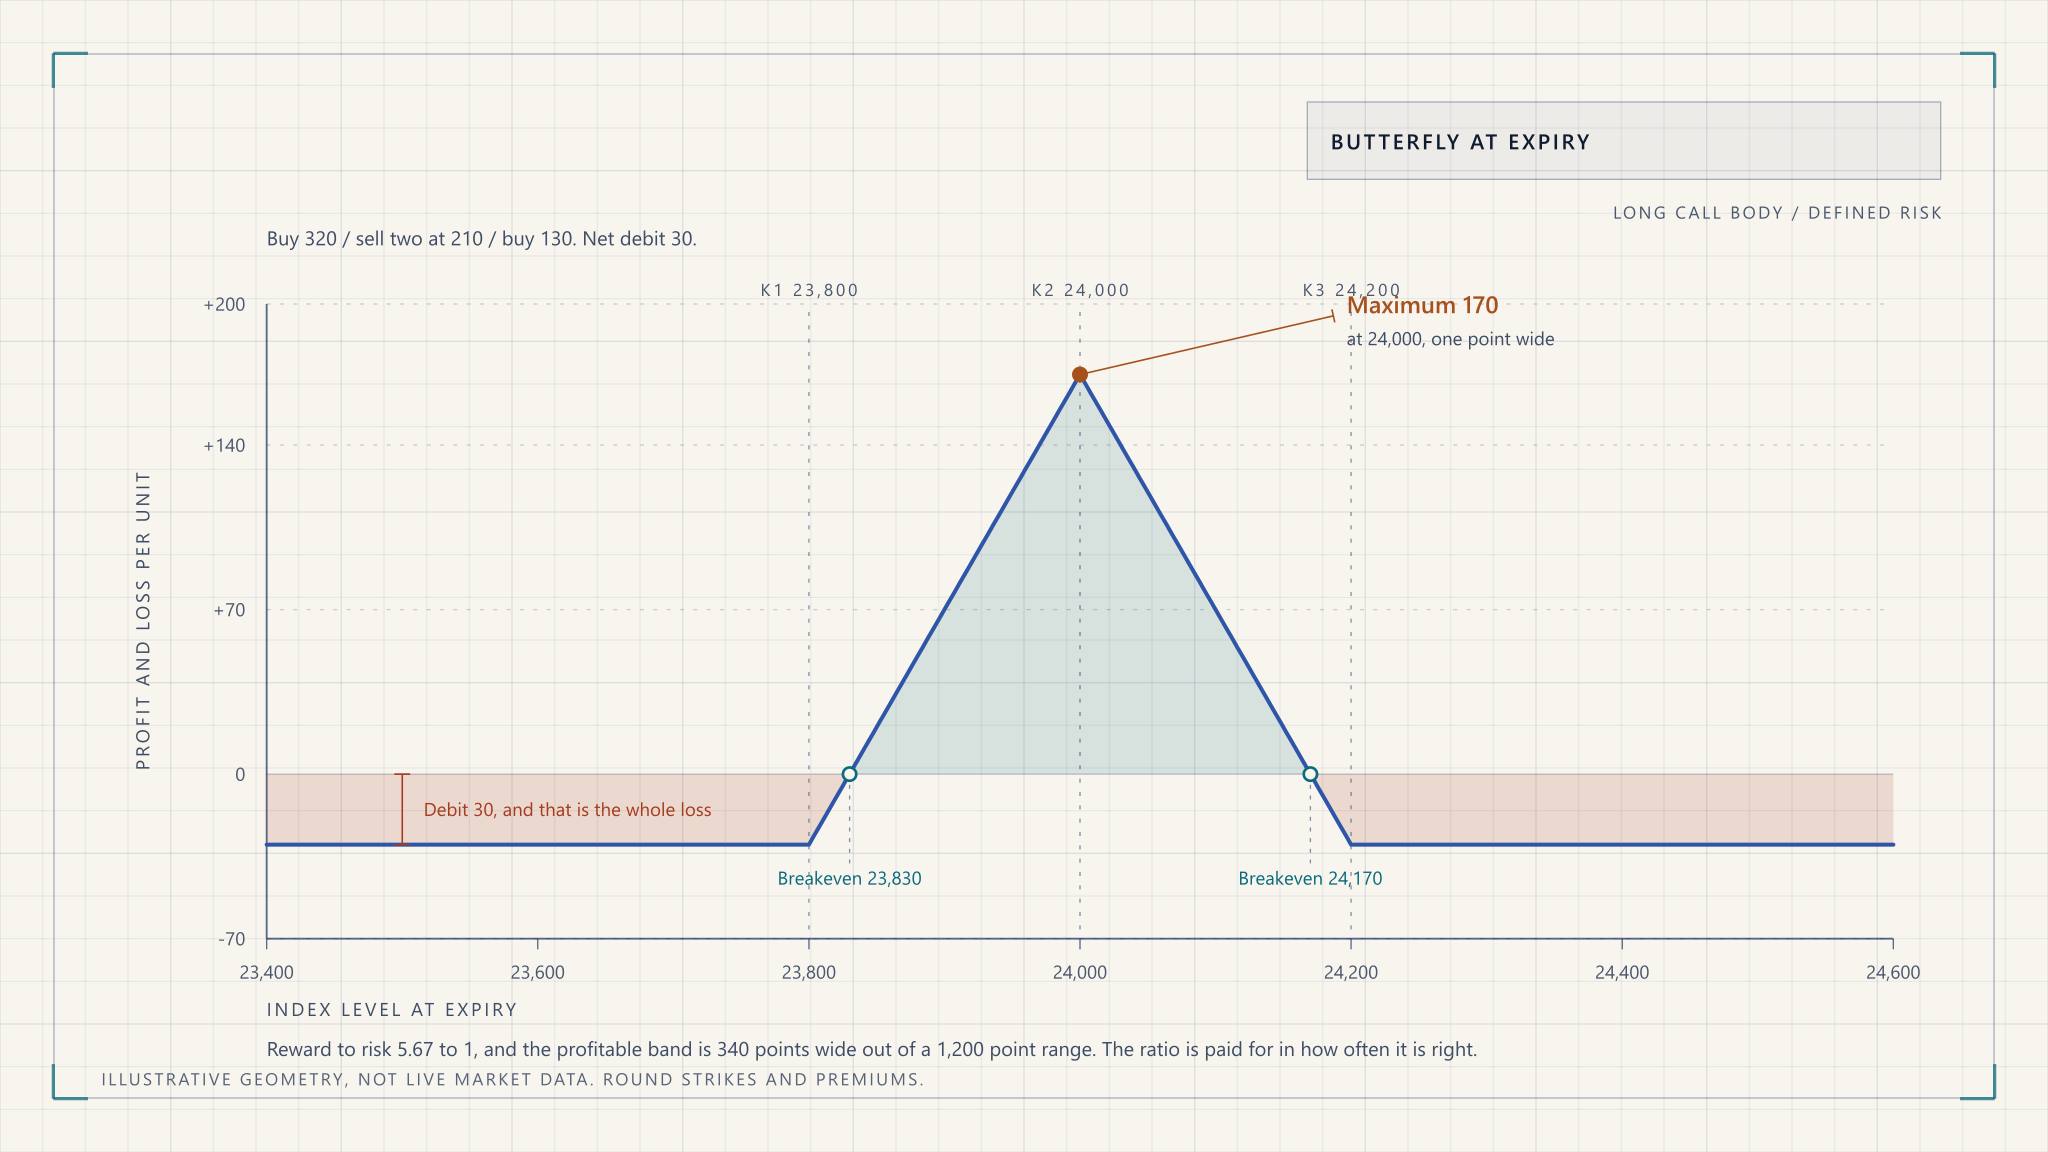
How butterfly options work: the payoff, how a butterfly settles at expiry, why iron and long butterflies are the same trade, and the risk in a broken wing.
Options & Income
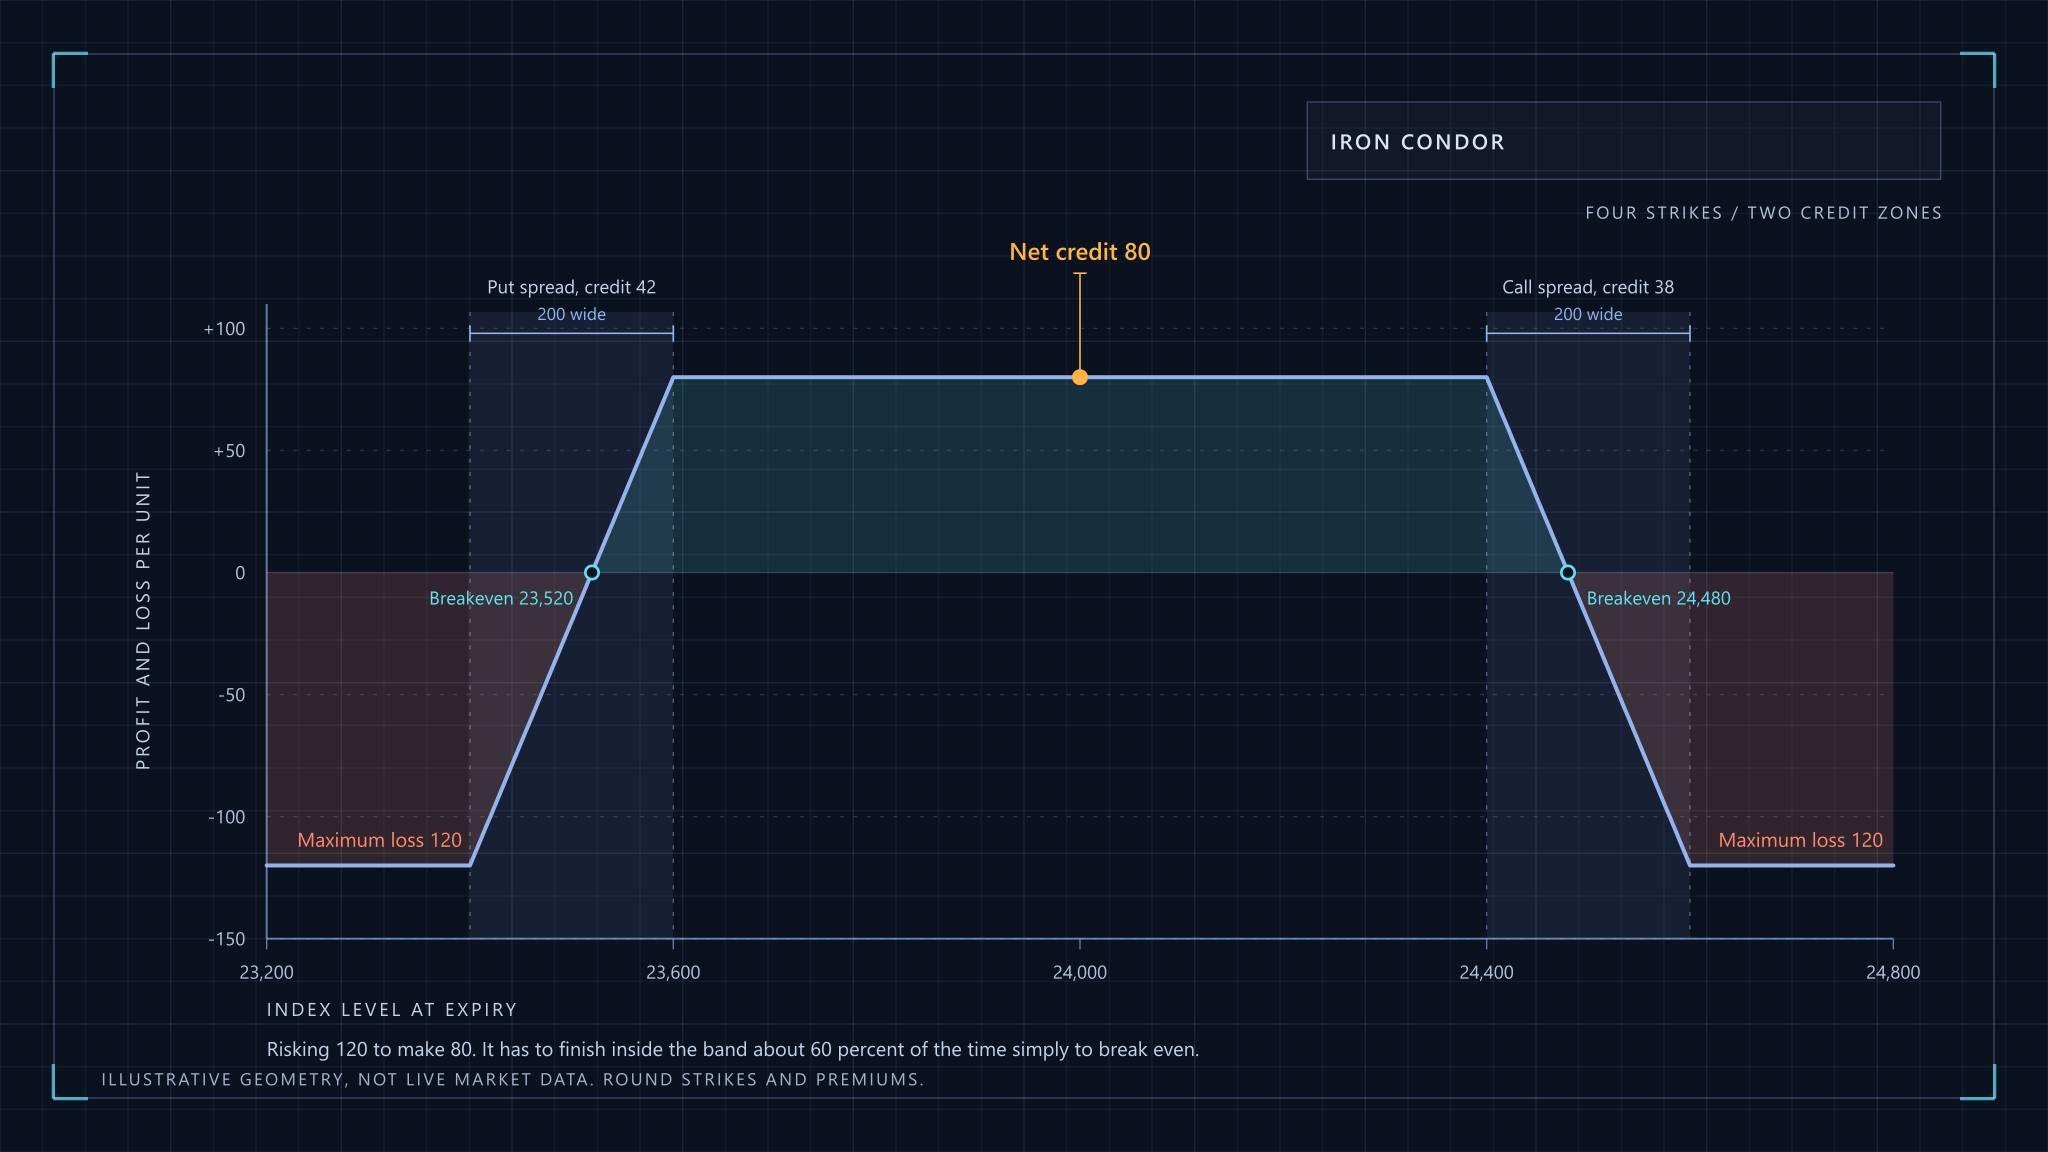
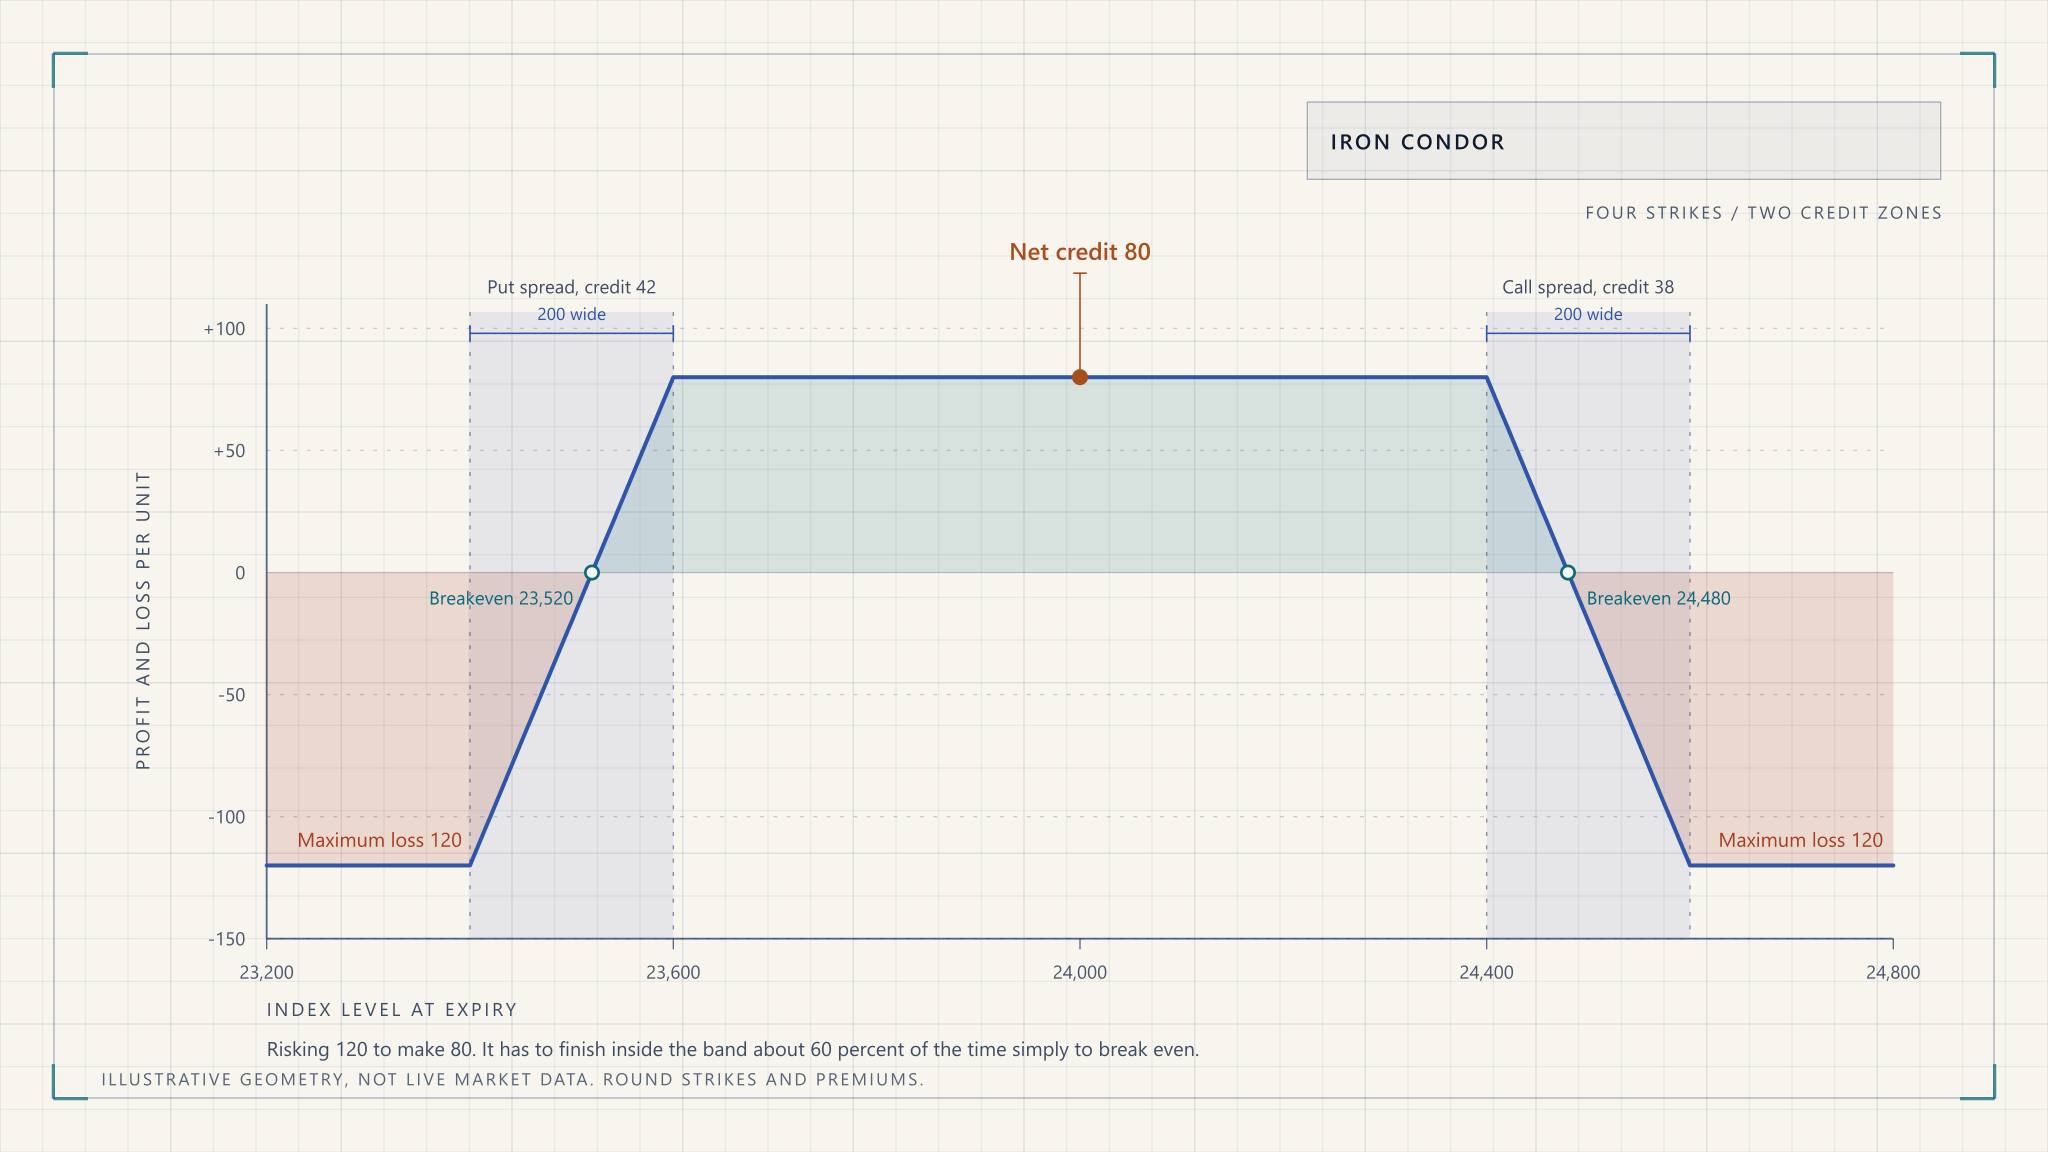
How credit spreads and iron condors work, what the premium compensates you for, the margin reality, and the payoff shape that catches option sellers out.
Options & Hedging
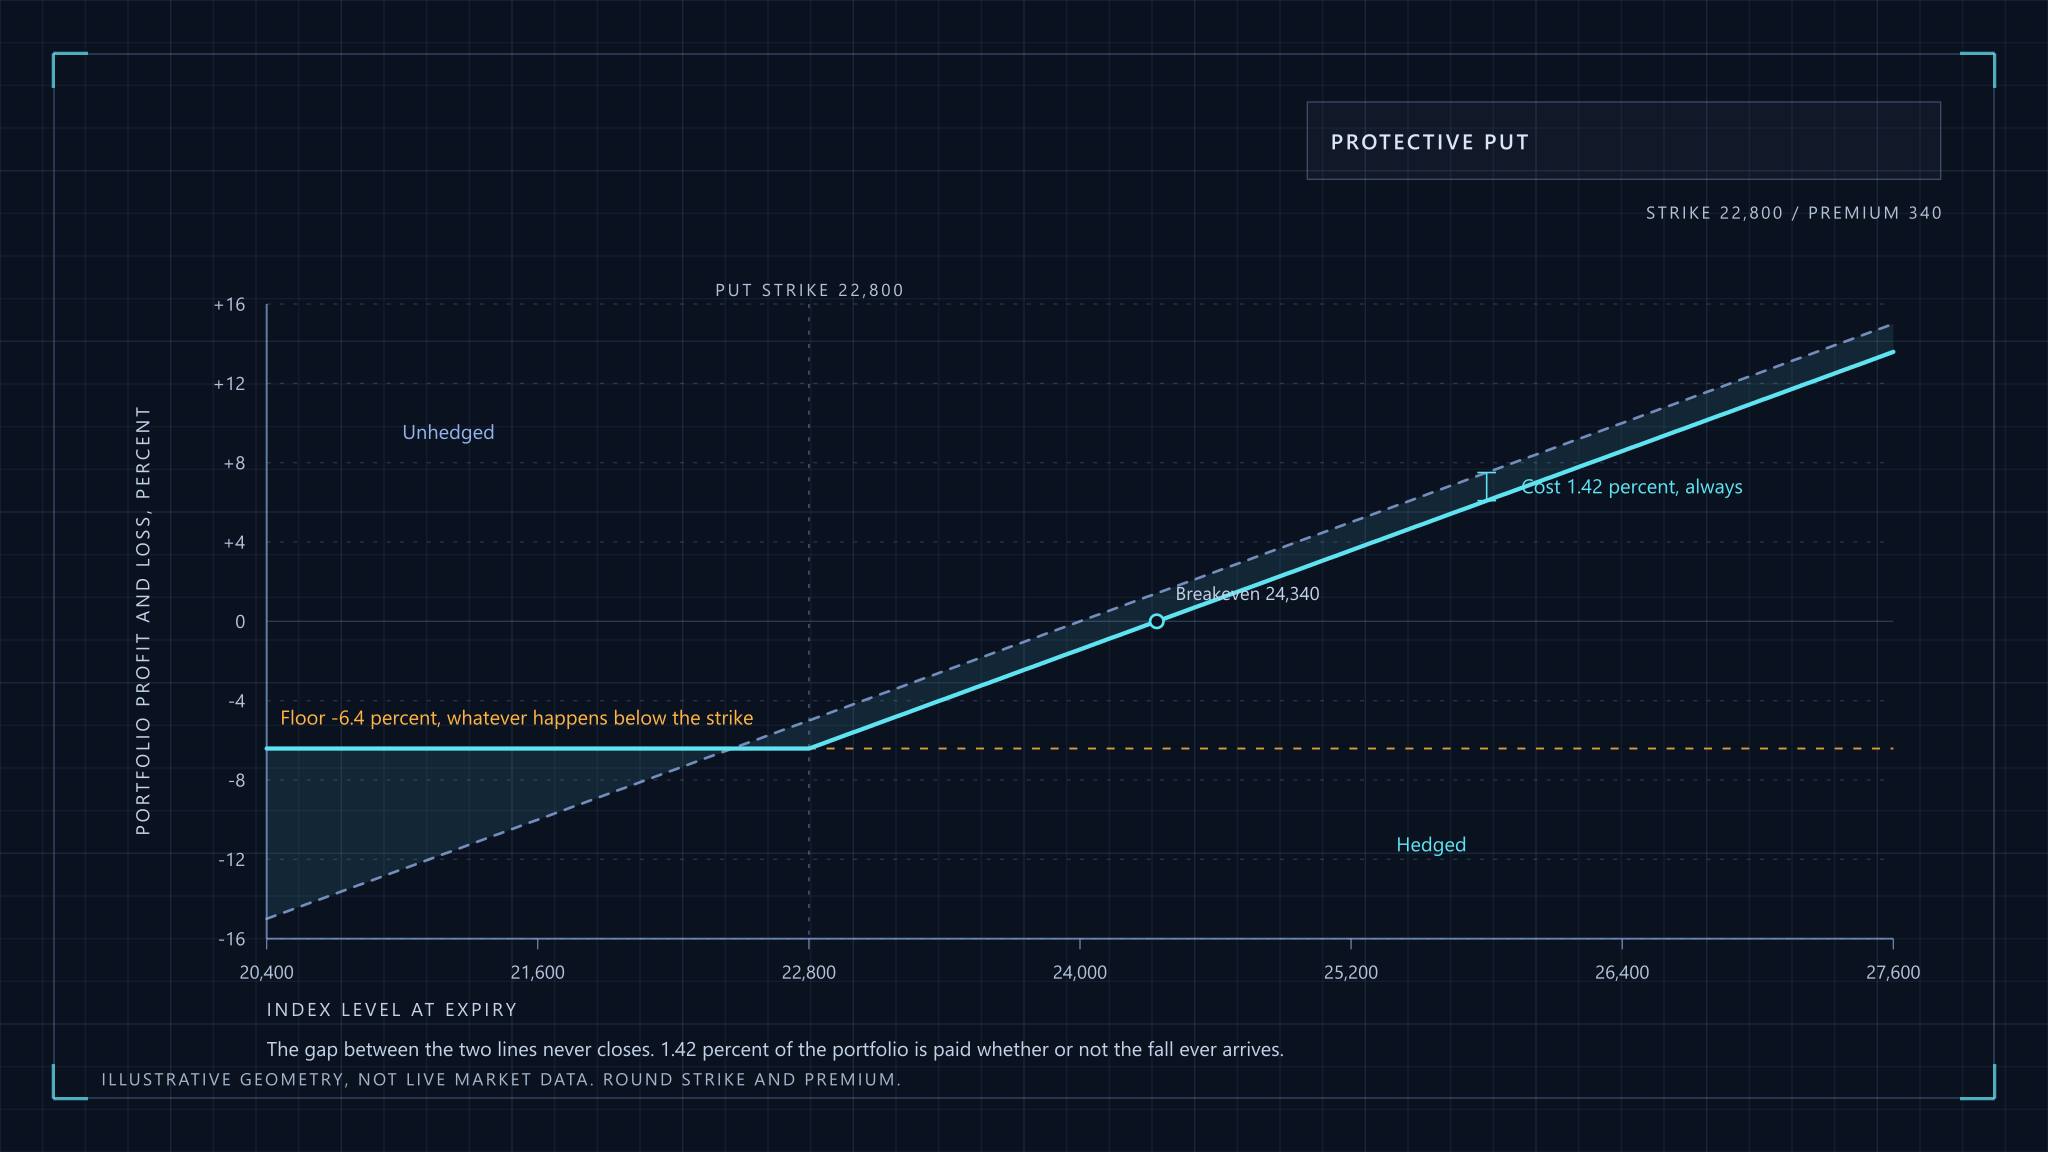
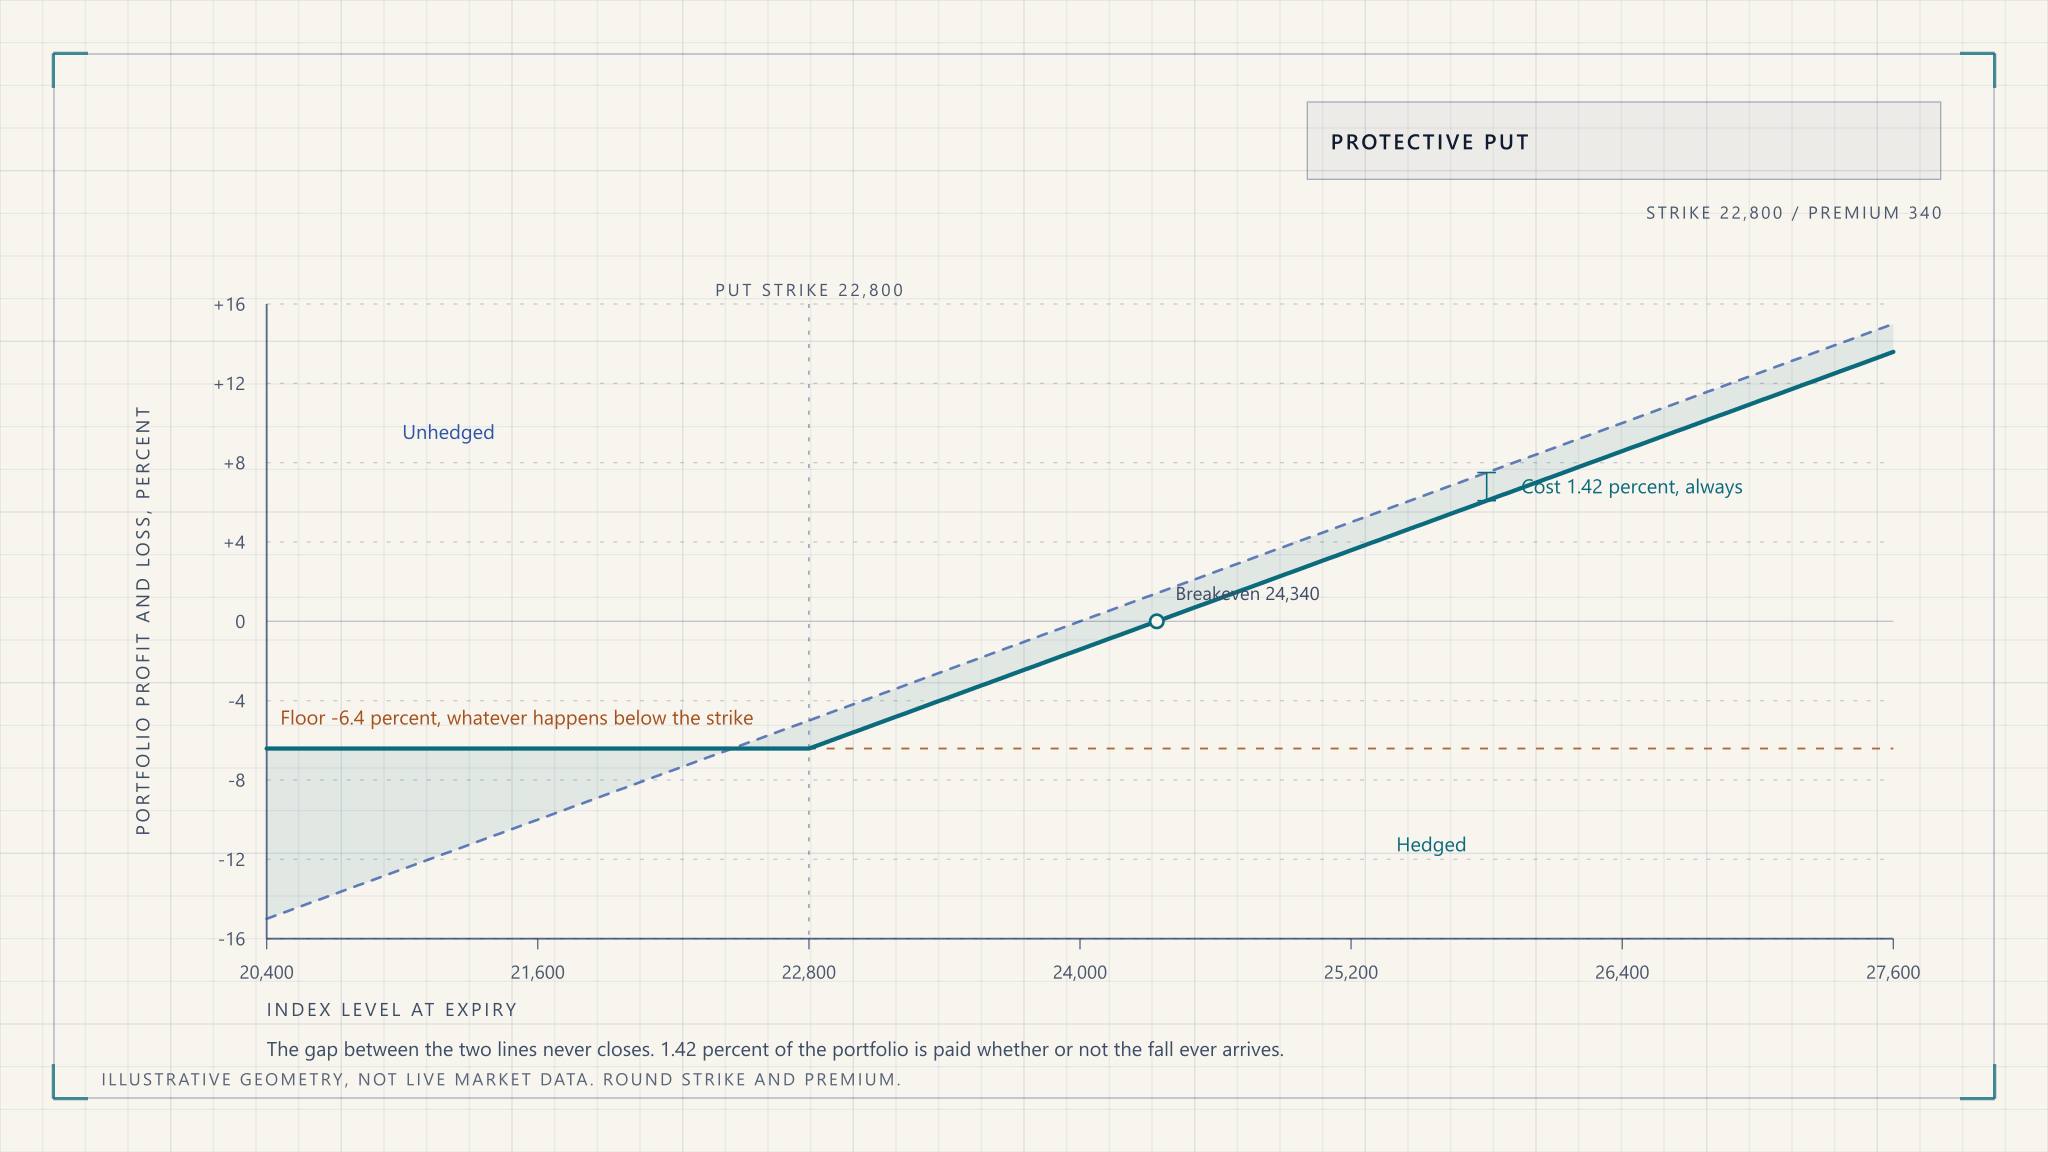
How to hedge an equity portfolio with index options: how much of it to hedge, sizing the contracts, what puts and collars really cost, and when not to bother.
Row 03 Models and the book
Machine Learning
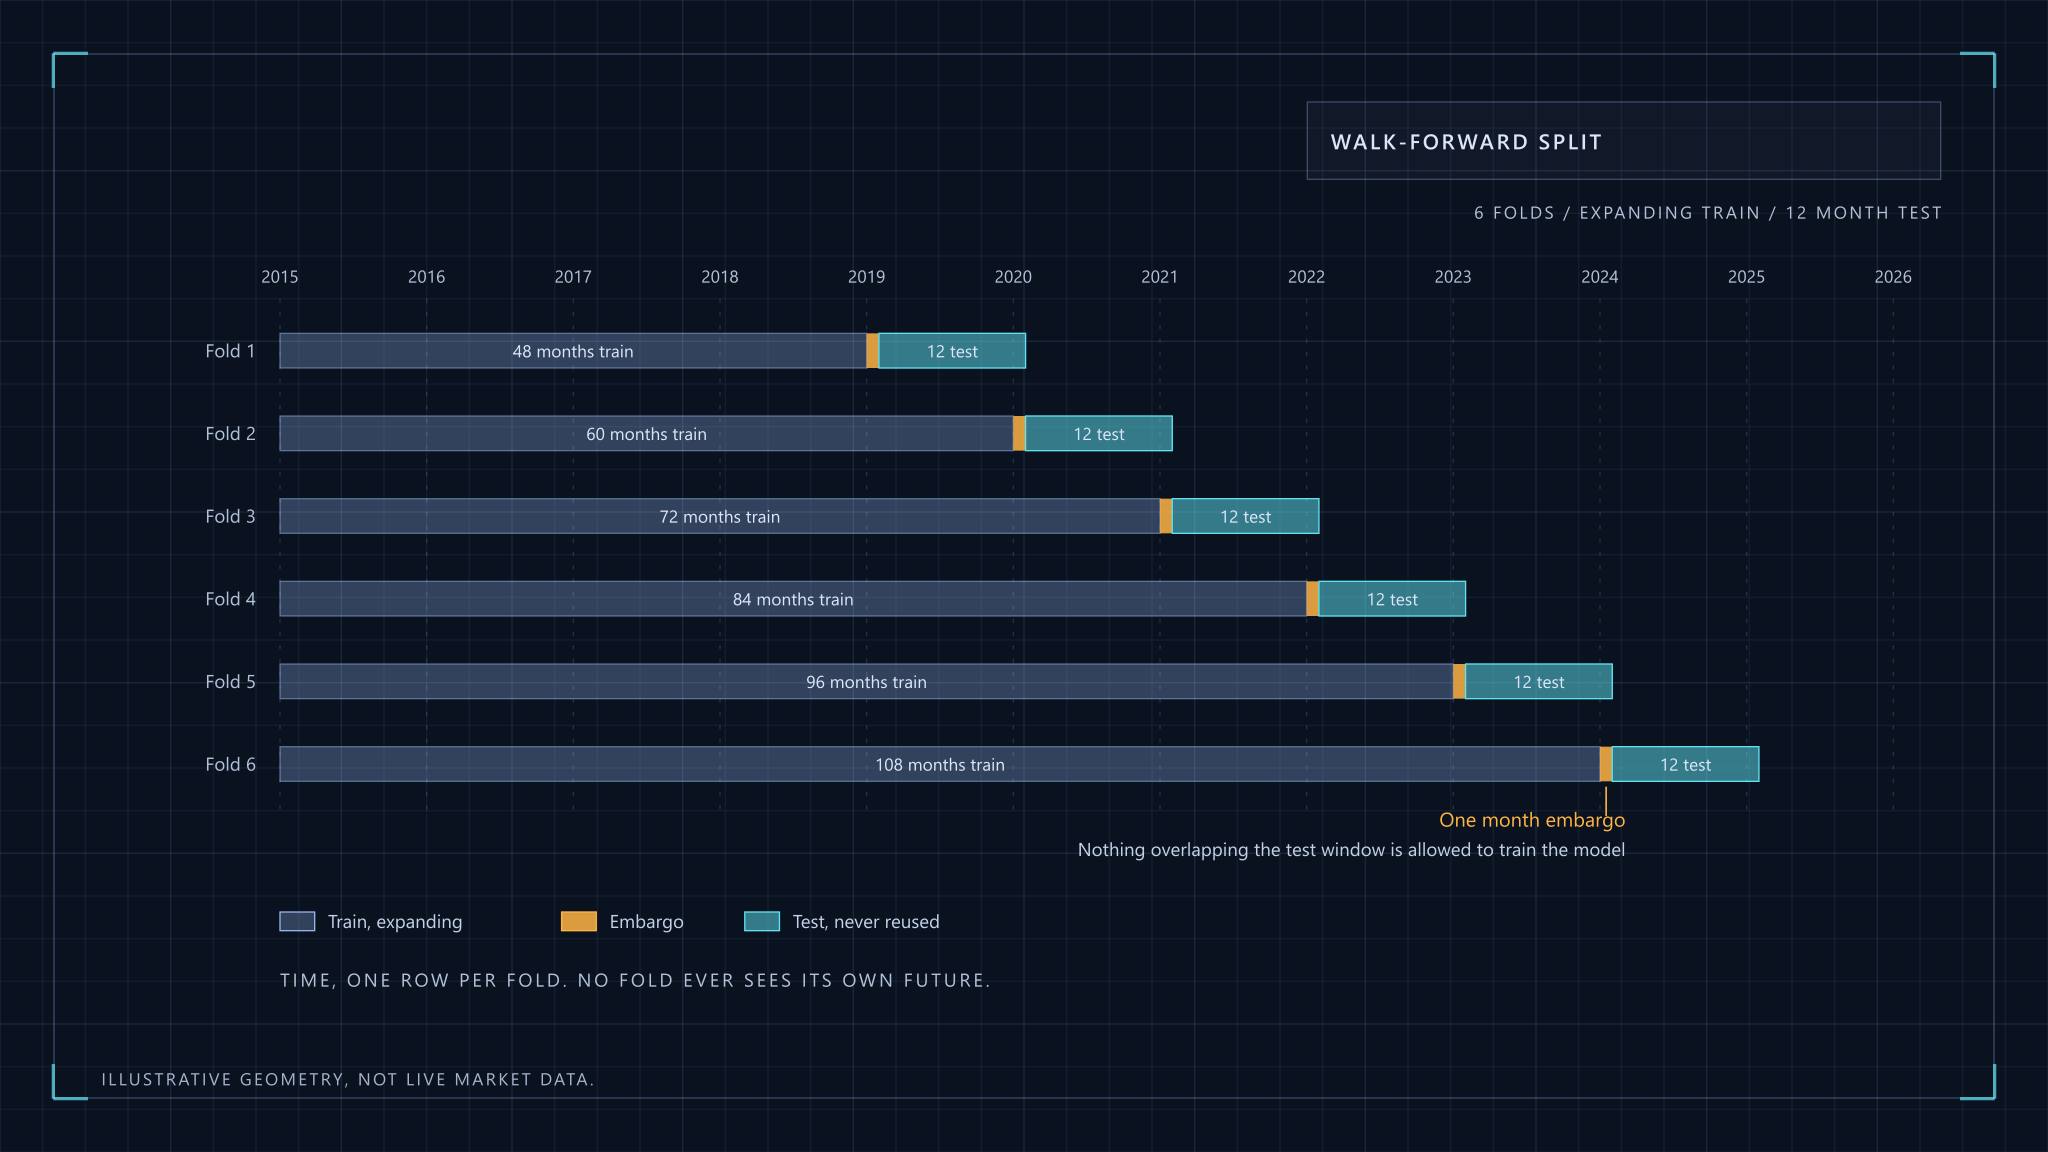
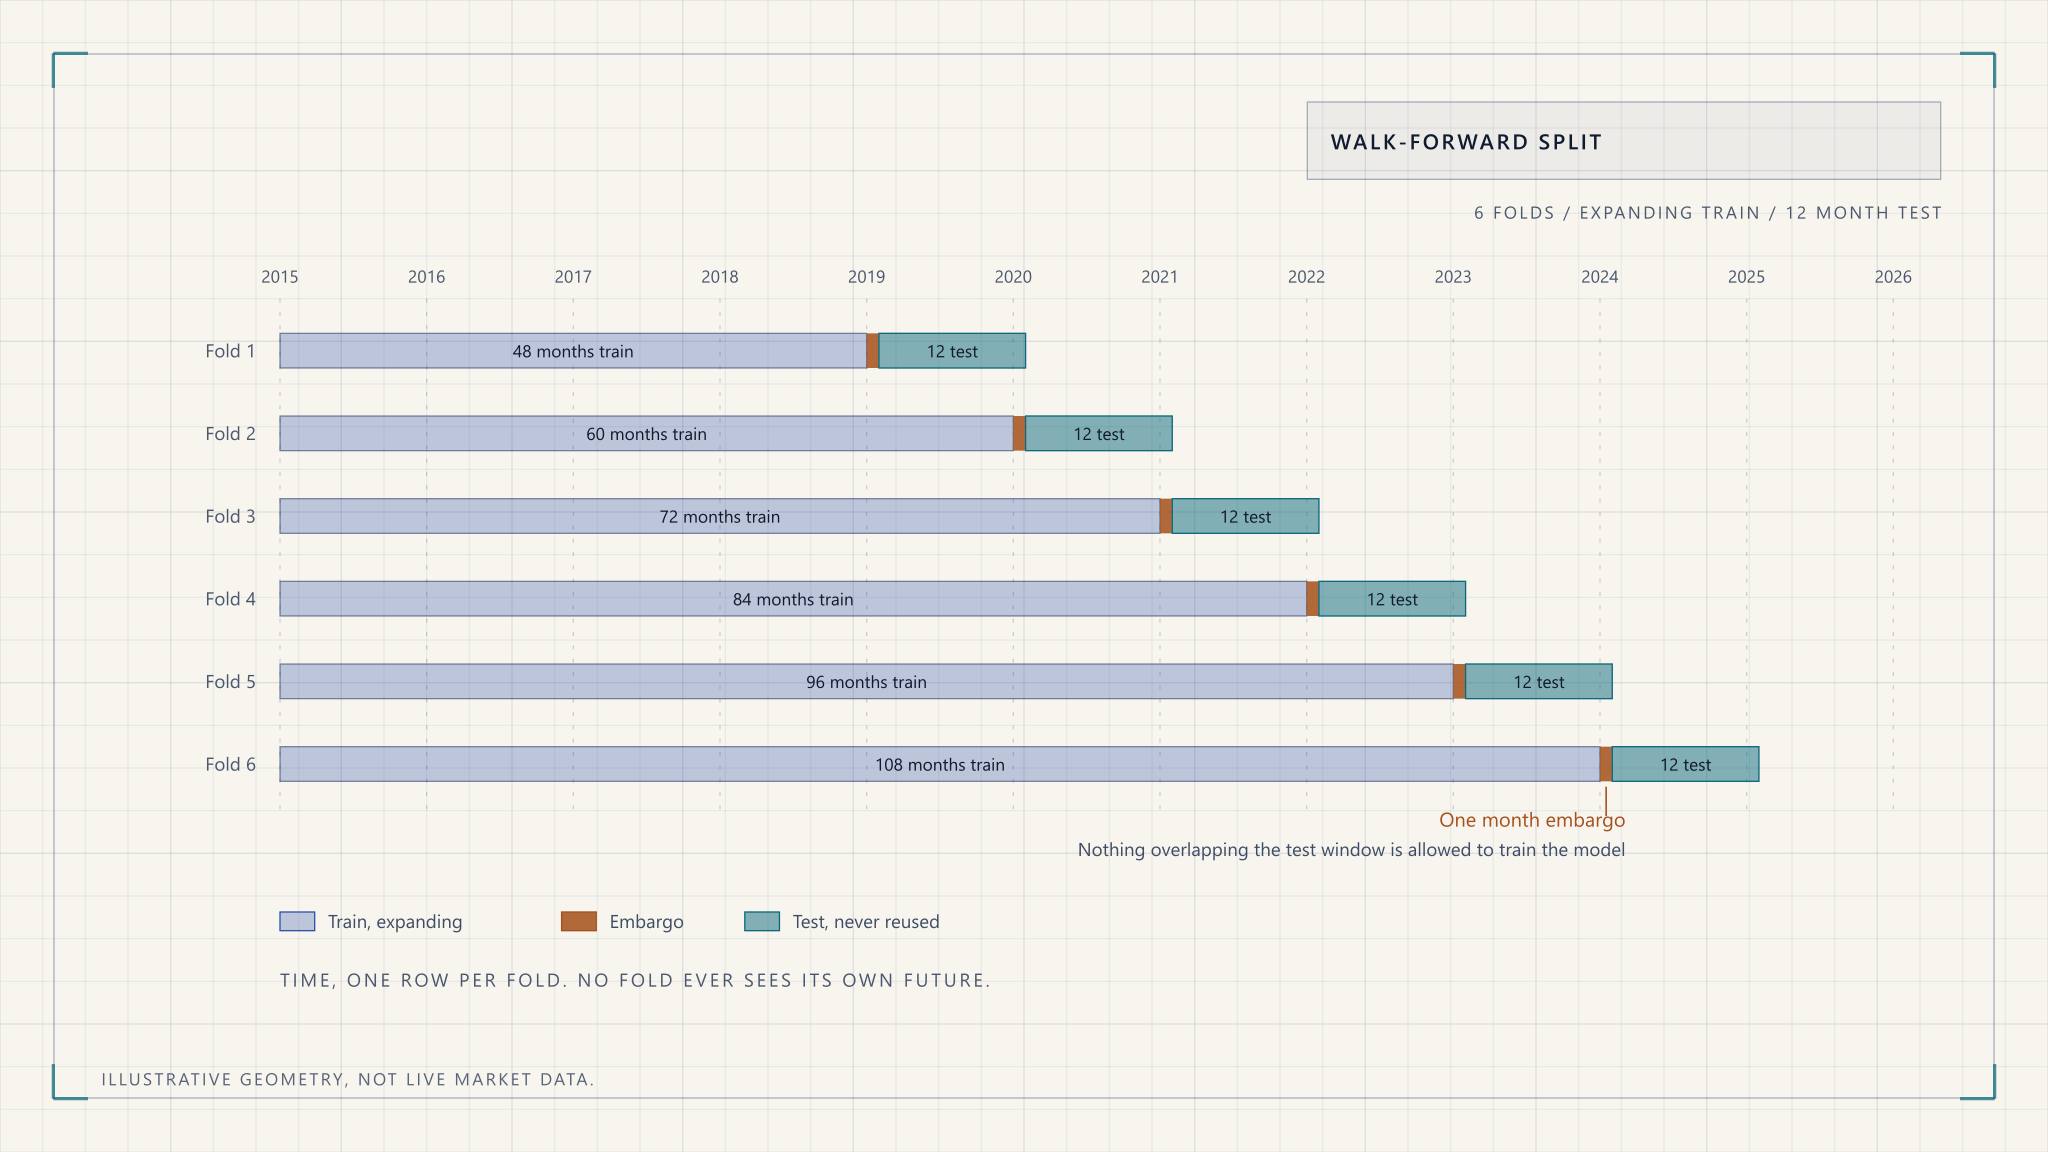
Machine learning for stock selection without fooling yourself: which models to try, walk-forward validation, where data leakage hides, and what survives costs.
Risk Management
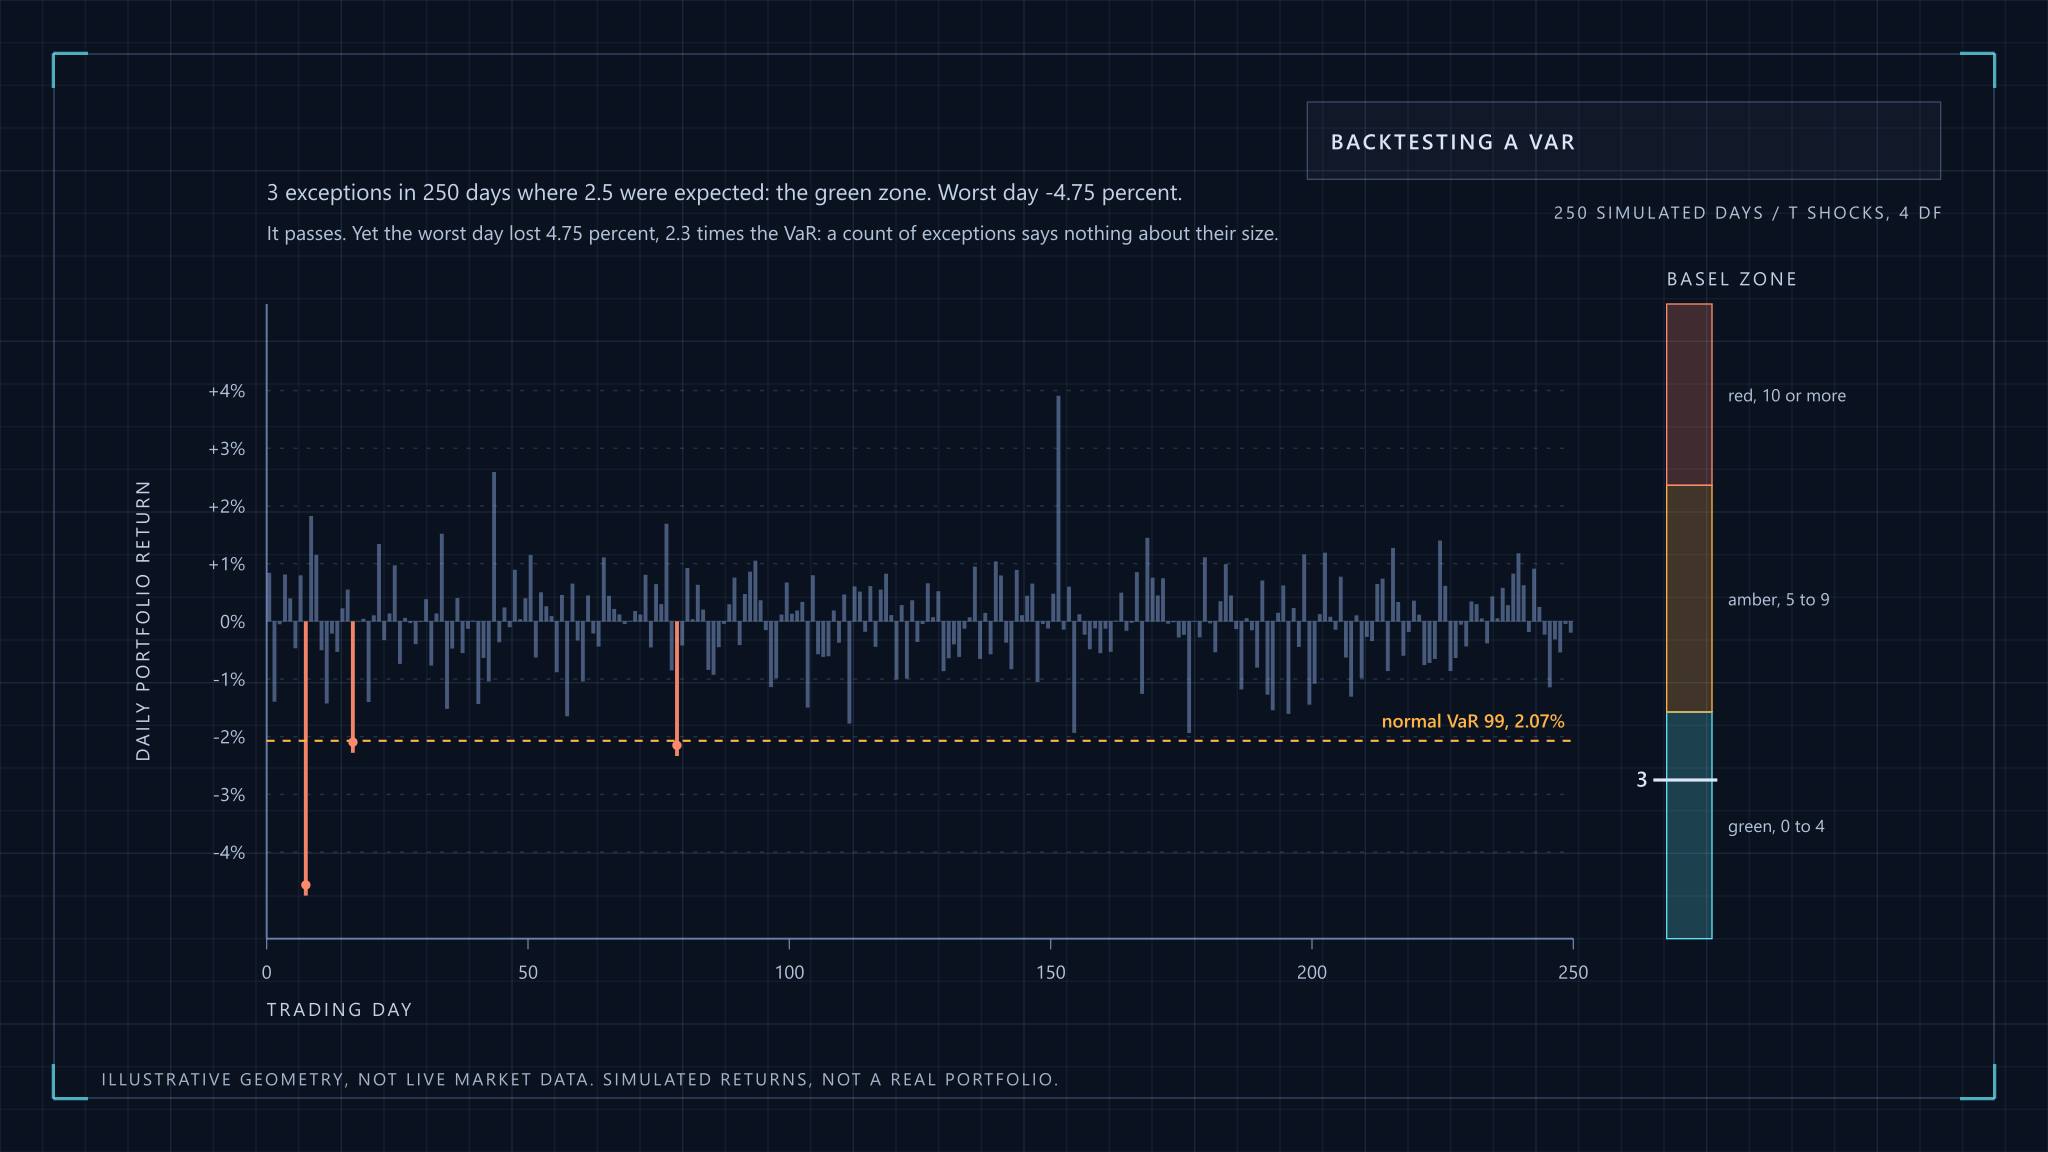
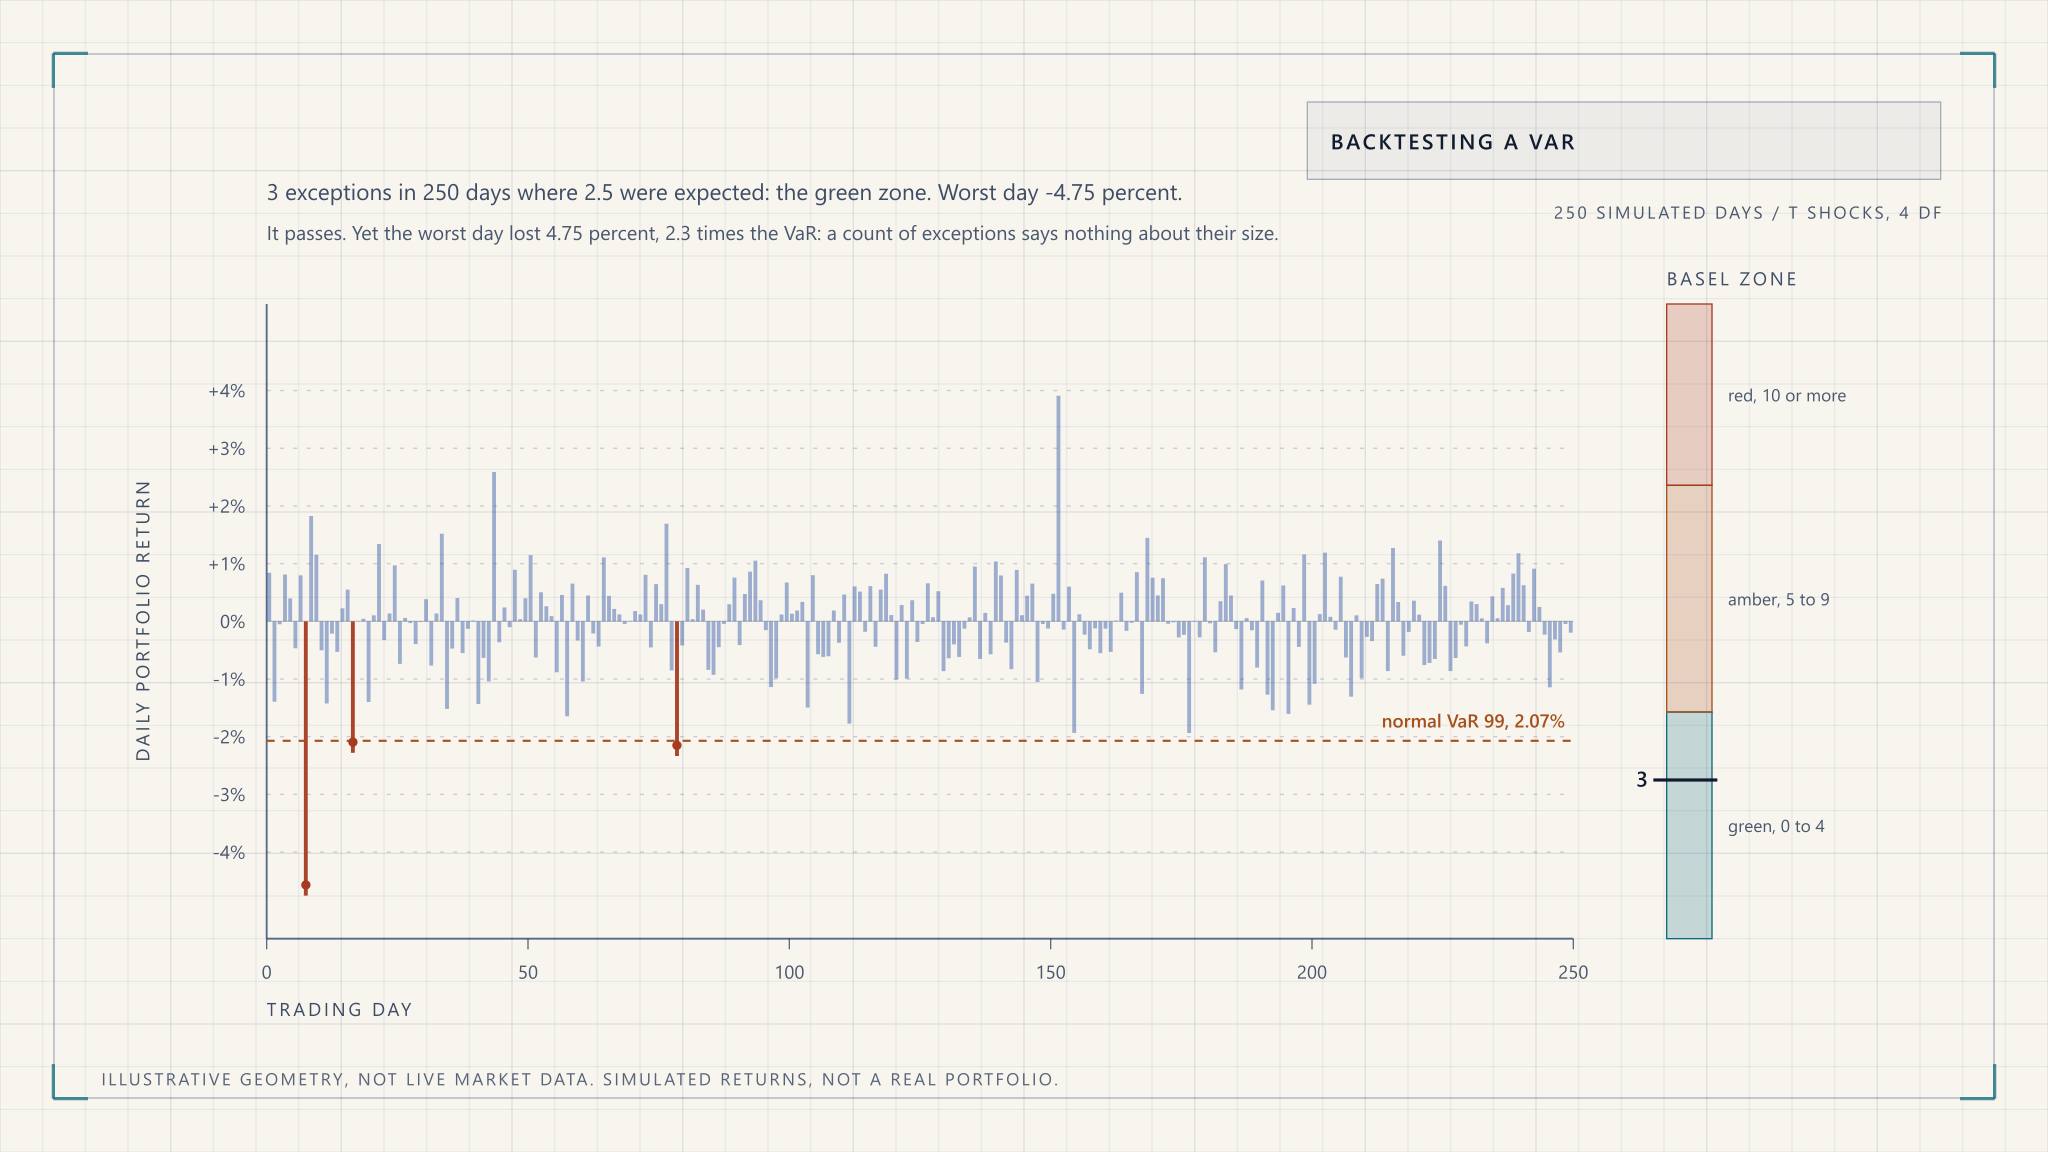
How Monte Carlo VaR works end to end: covariance, Cholesky shocks, full revaluation, fat tails, convergence, backtesting and expected shortfall.
Risk Management
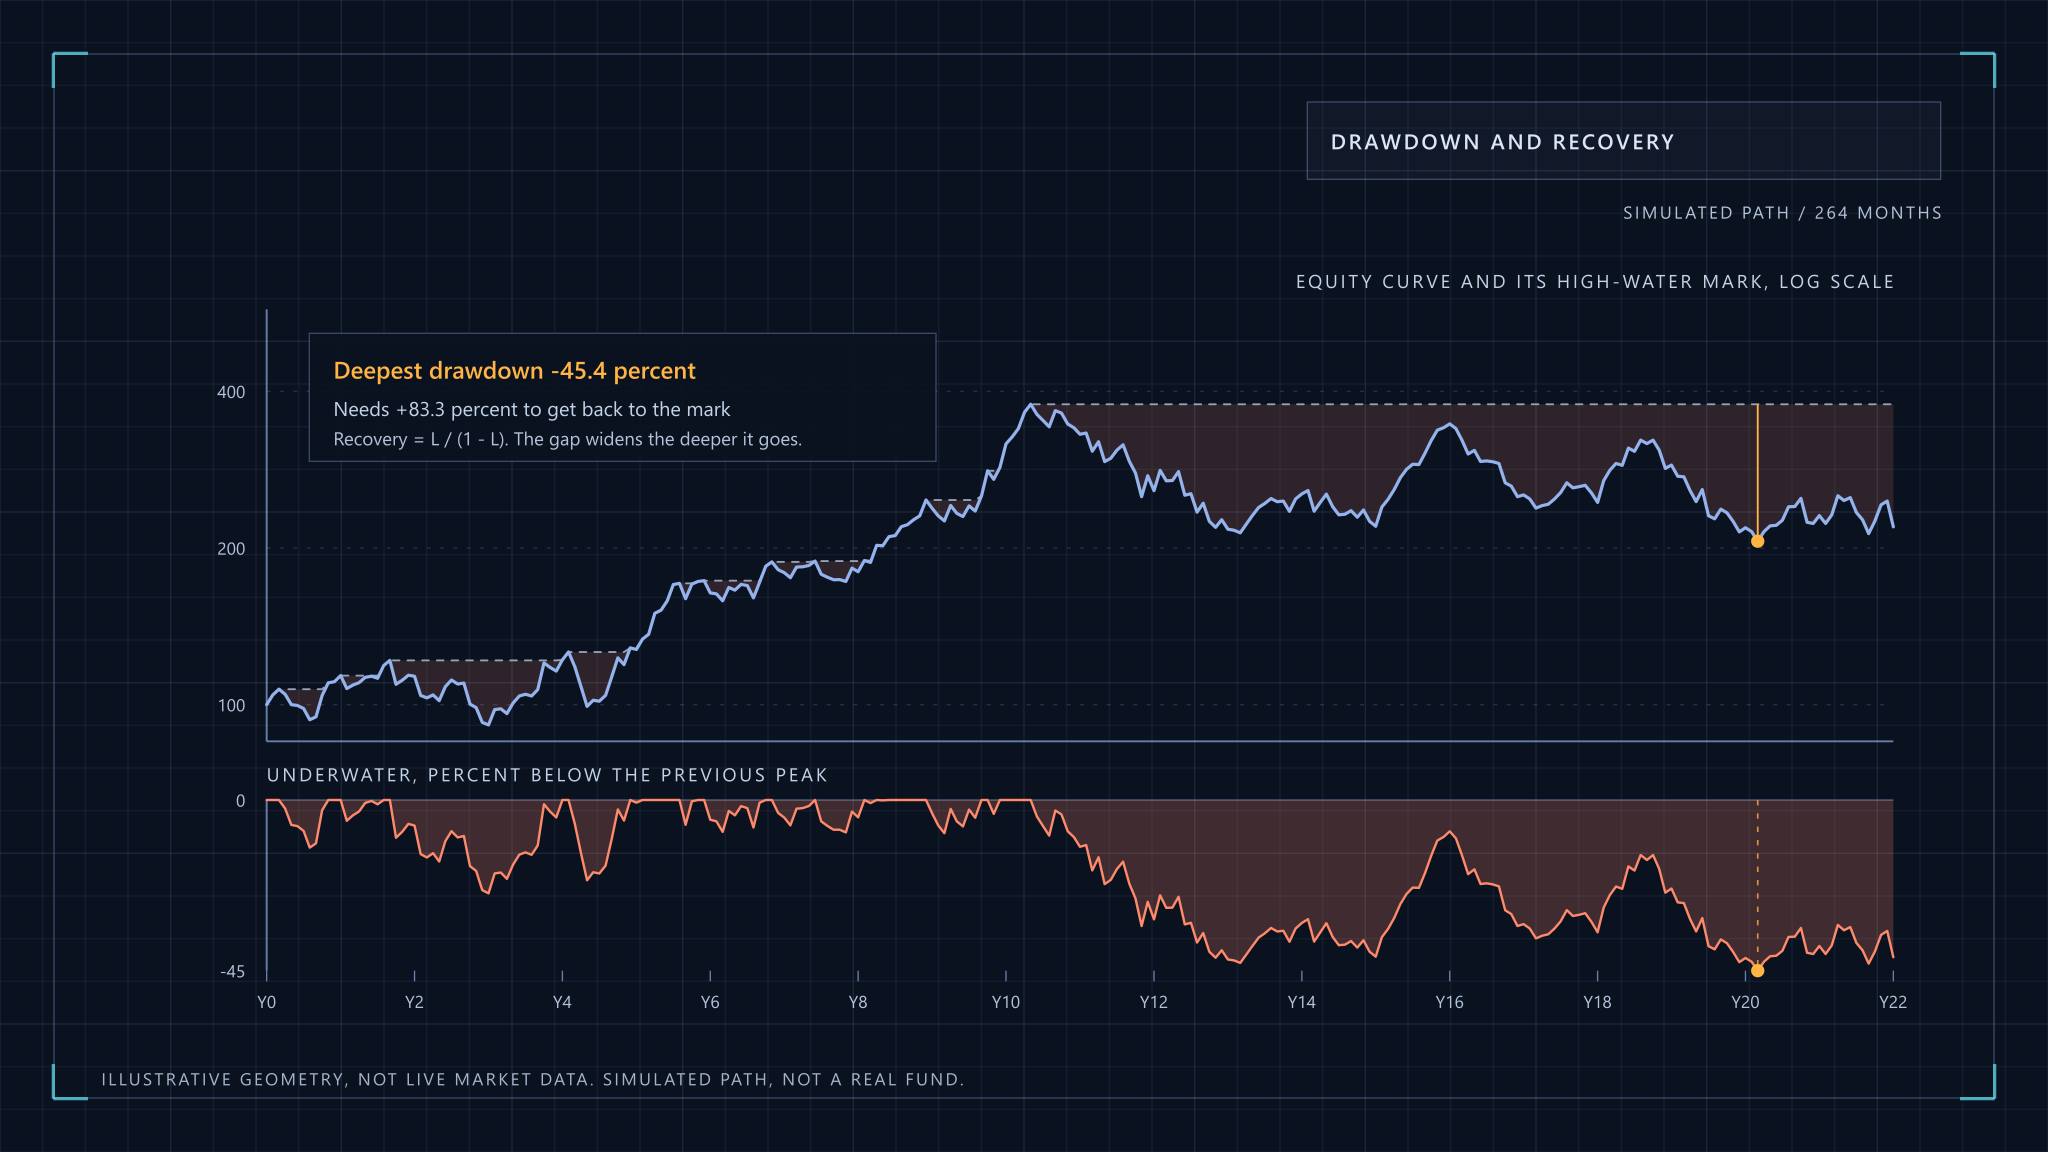
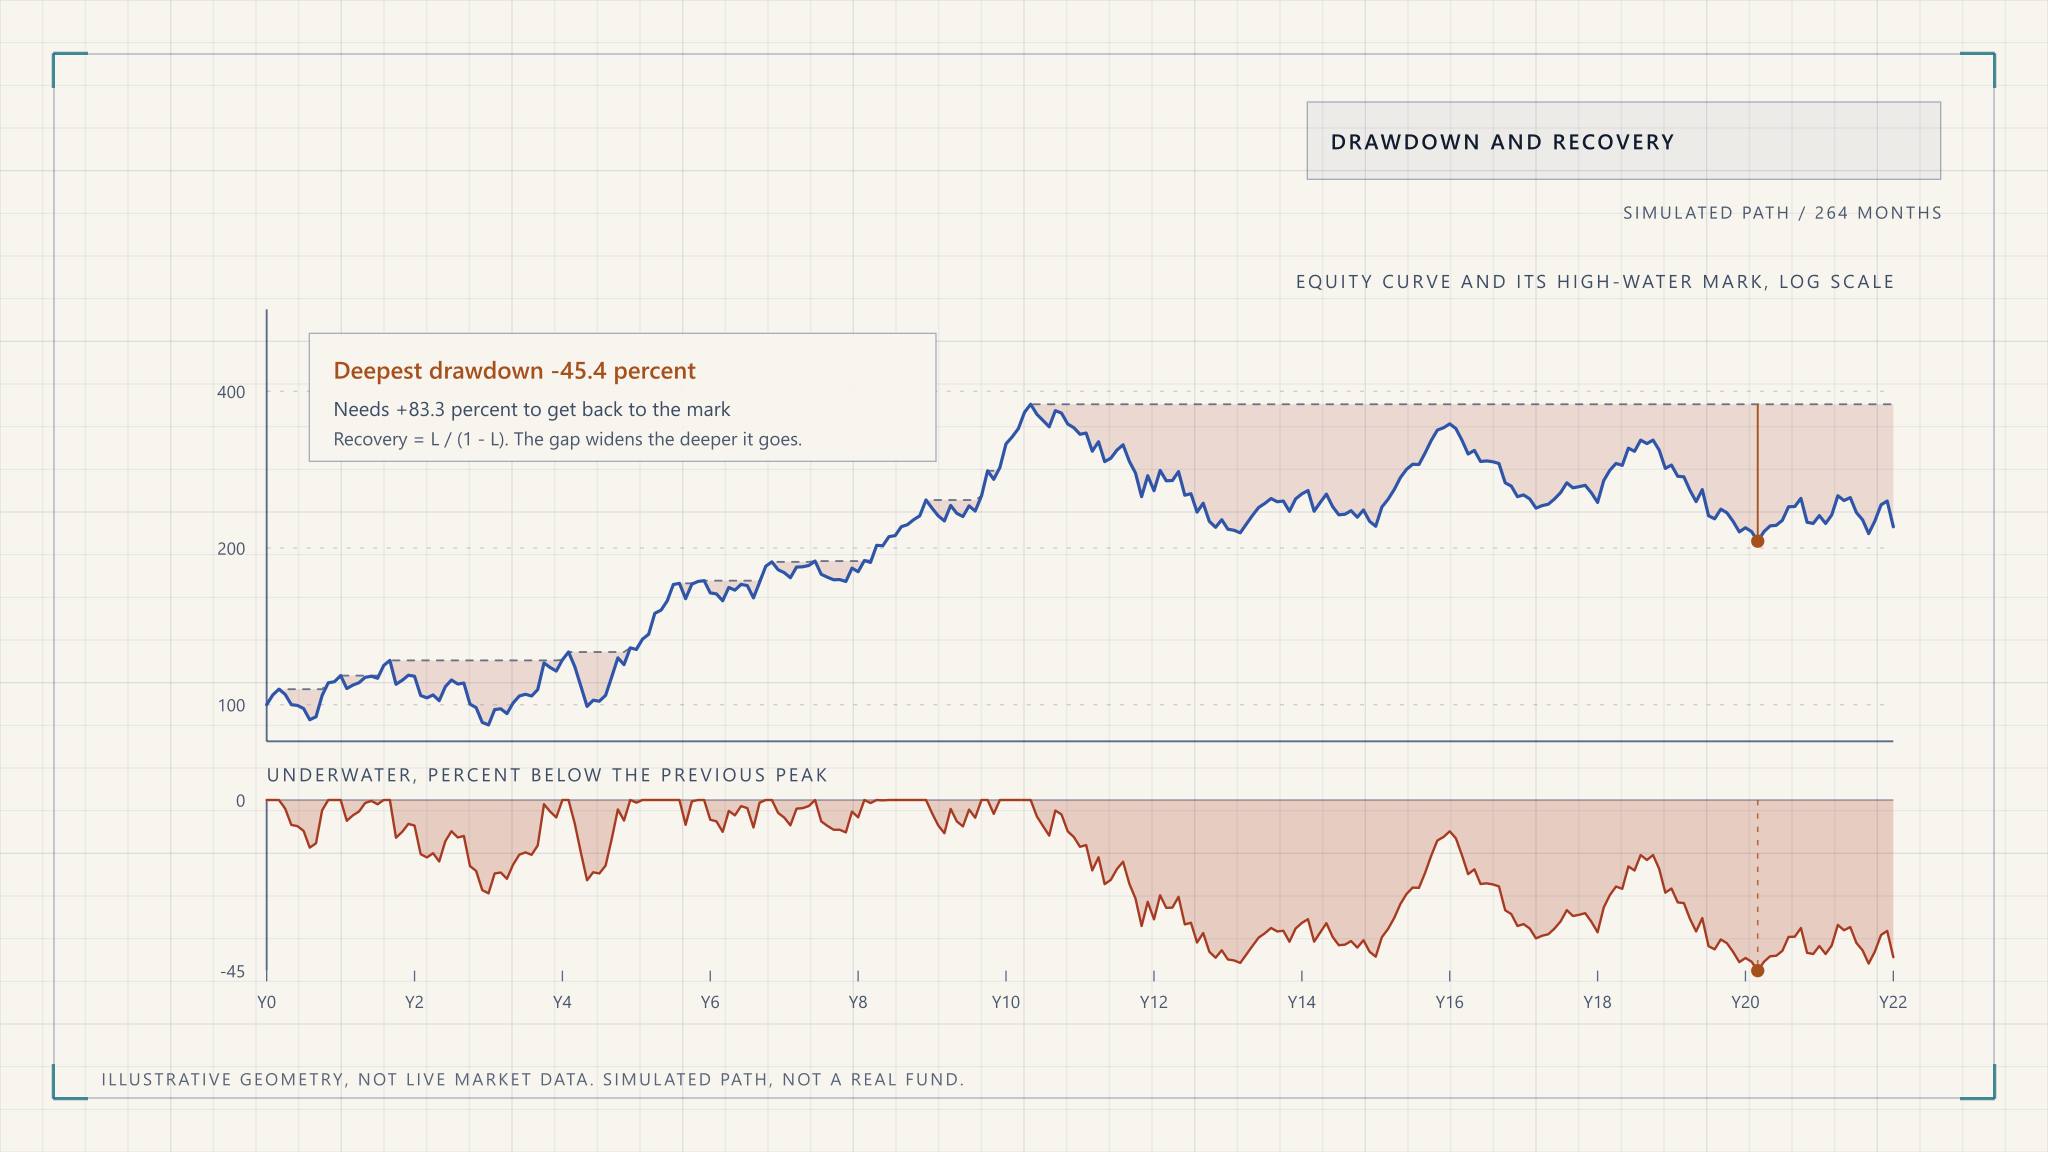
Why drawdowns are harder to recover than they look, what Value at Risk does and does not tell you, and how to size positions so a bad month stays survivable.
Portfolio Management
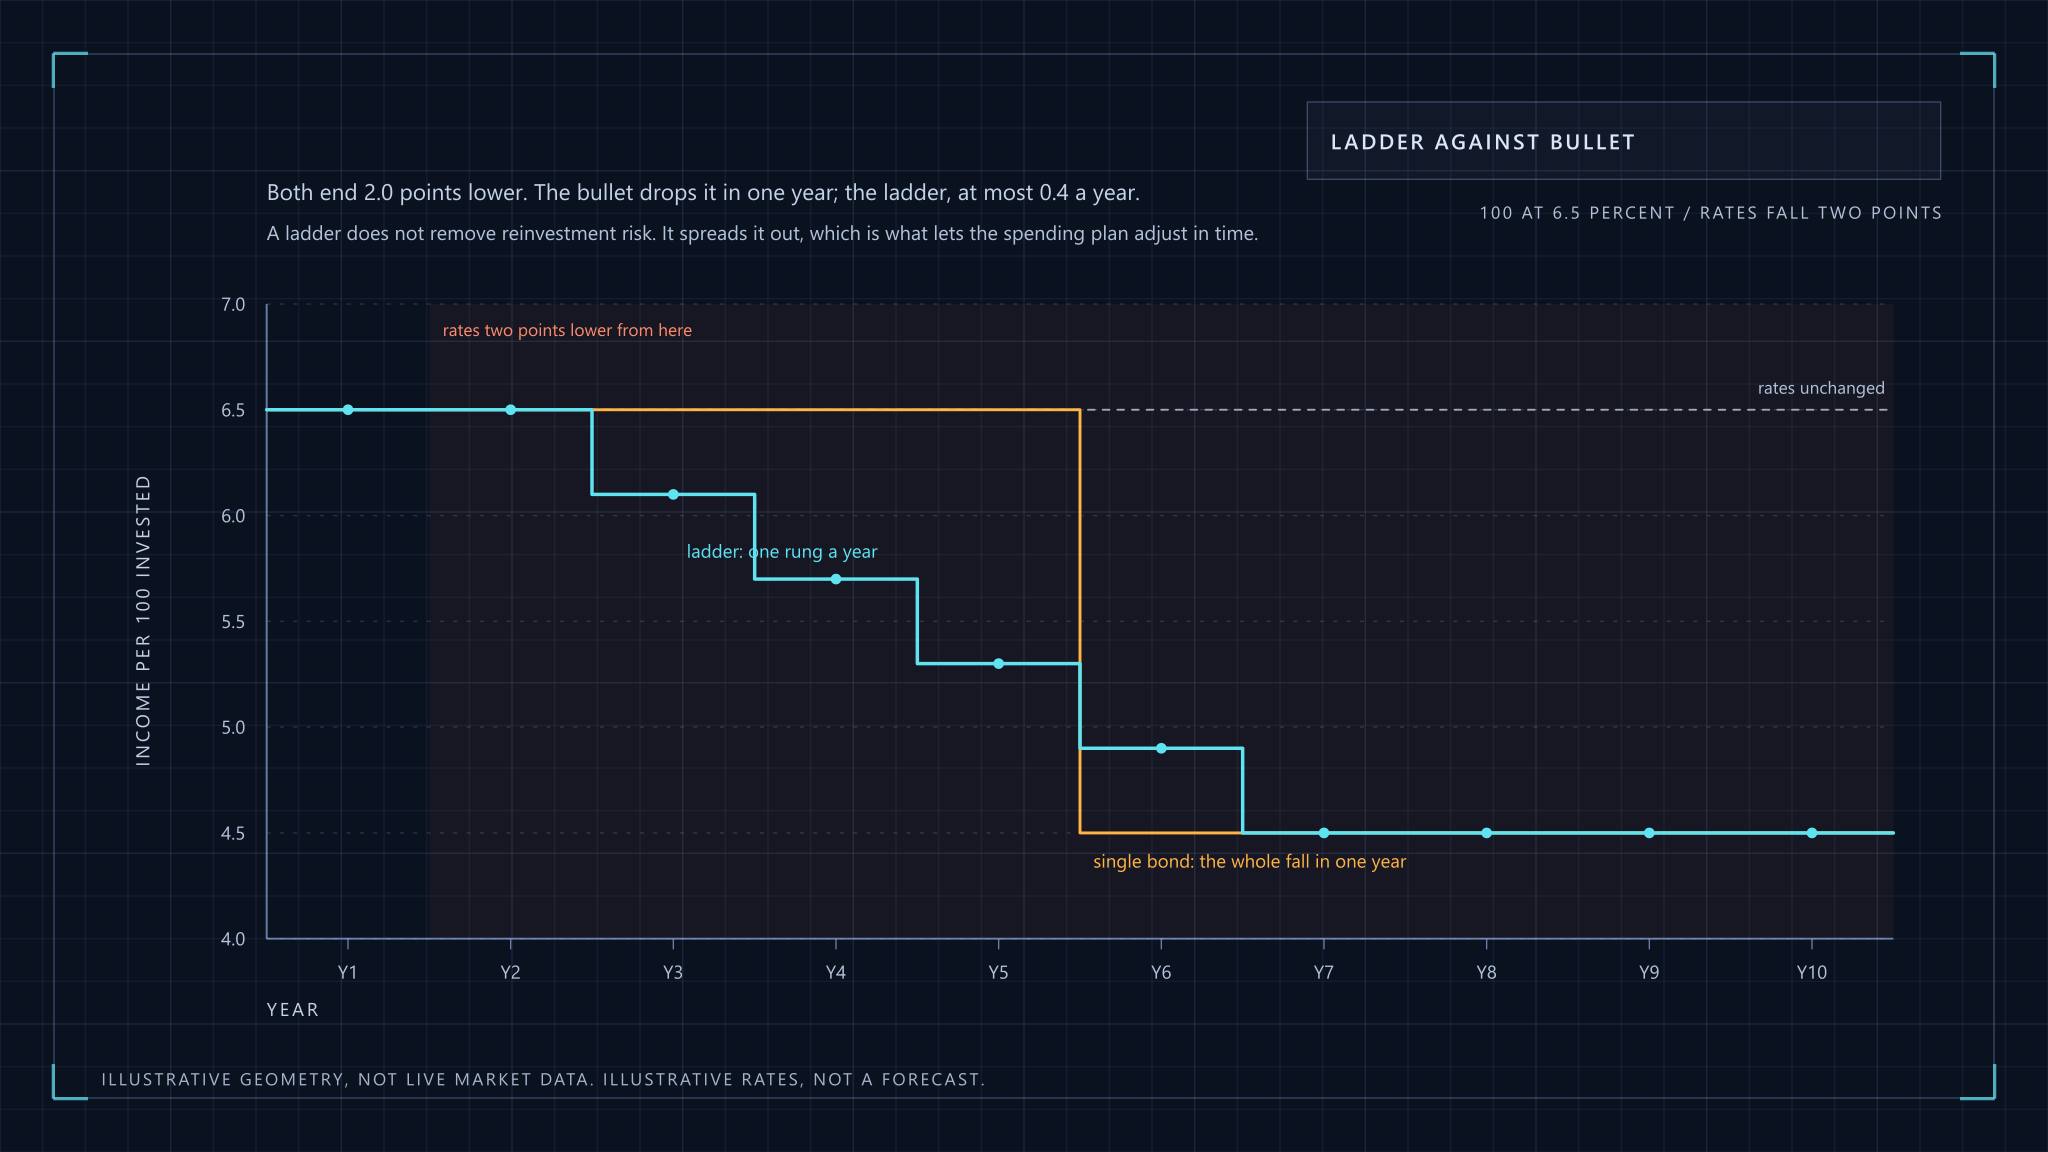
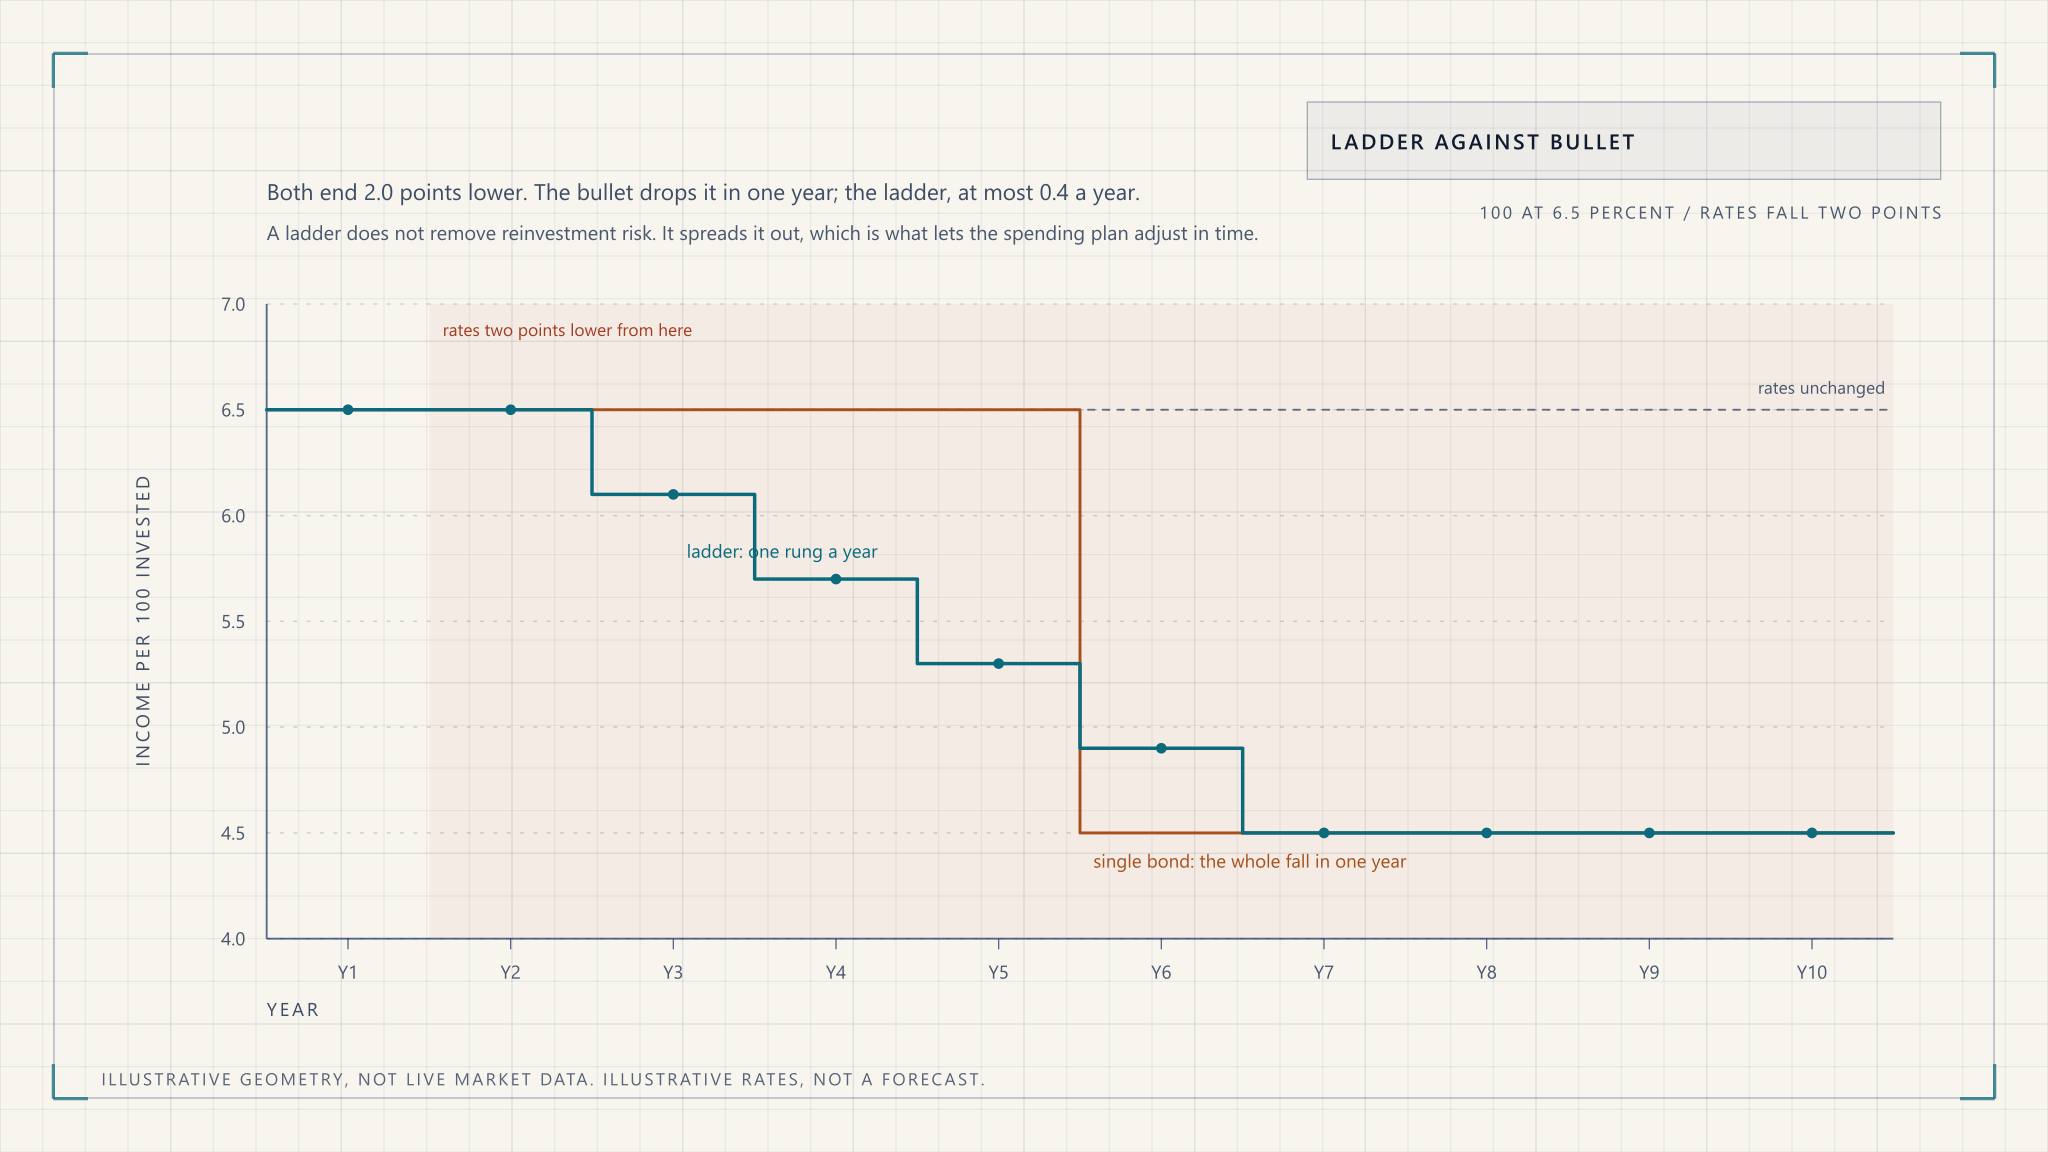
Build a portfolio for cash flow rather than headline yield: duration and reinvestment, yield traps, REITs and InvITs, and stress-testing the income itself.
Portfolio Management
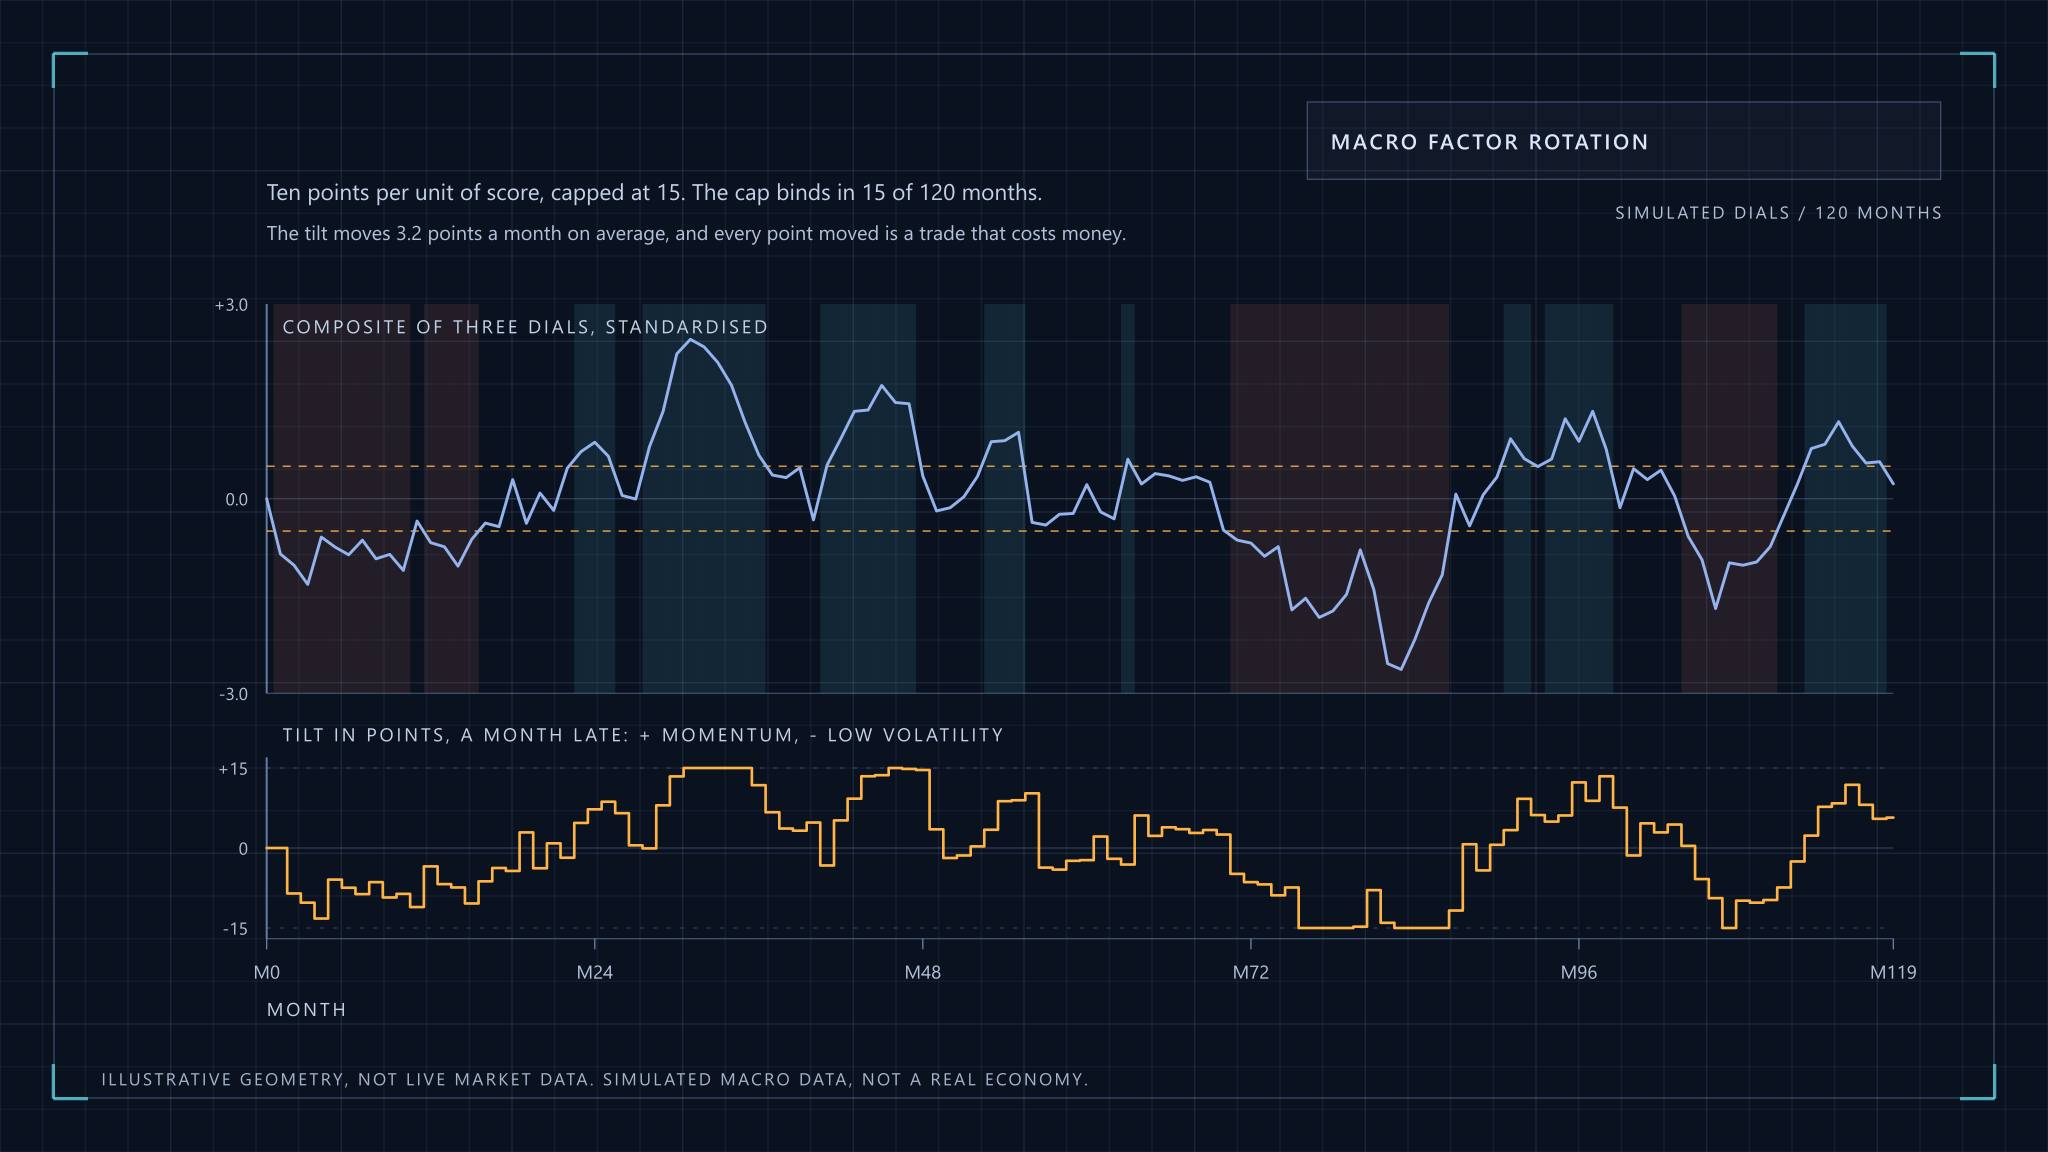
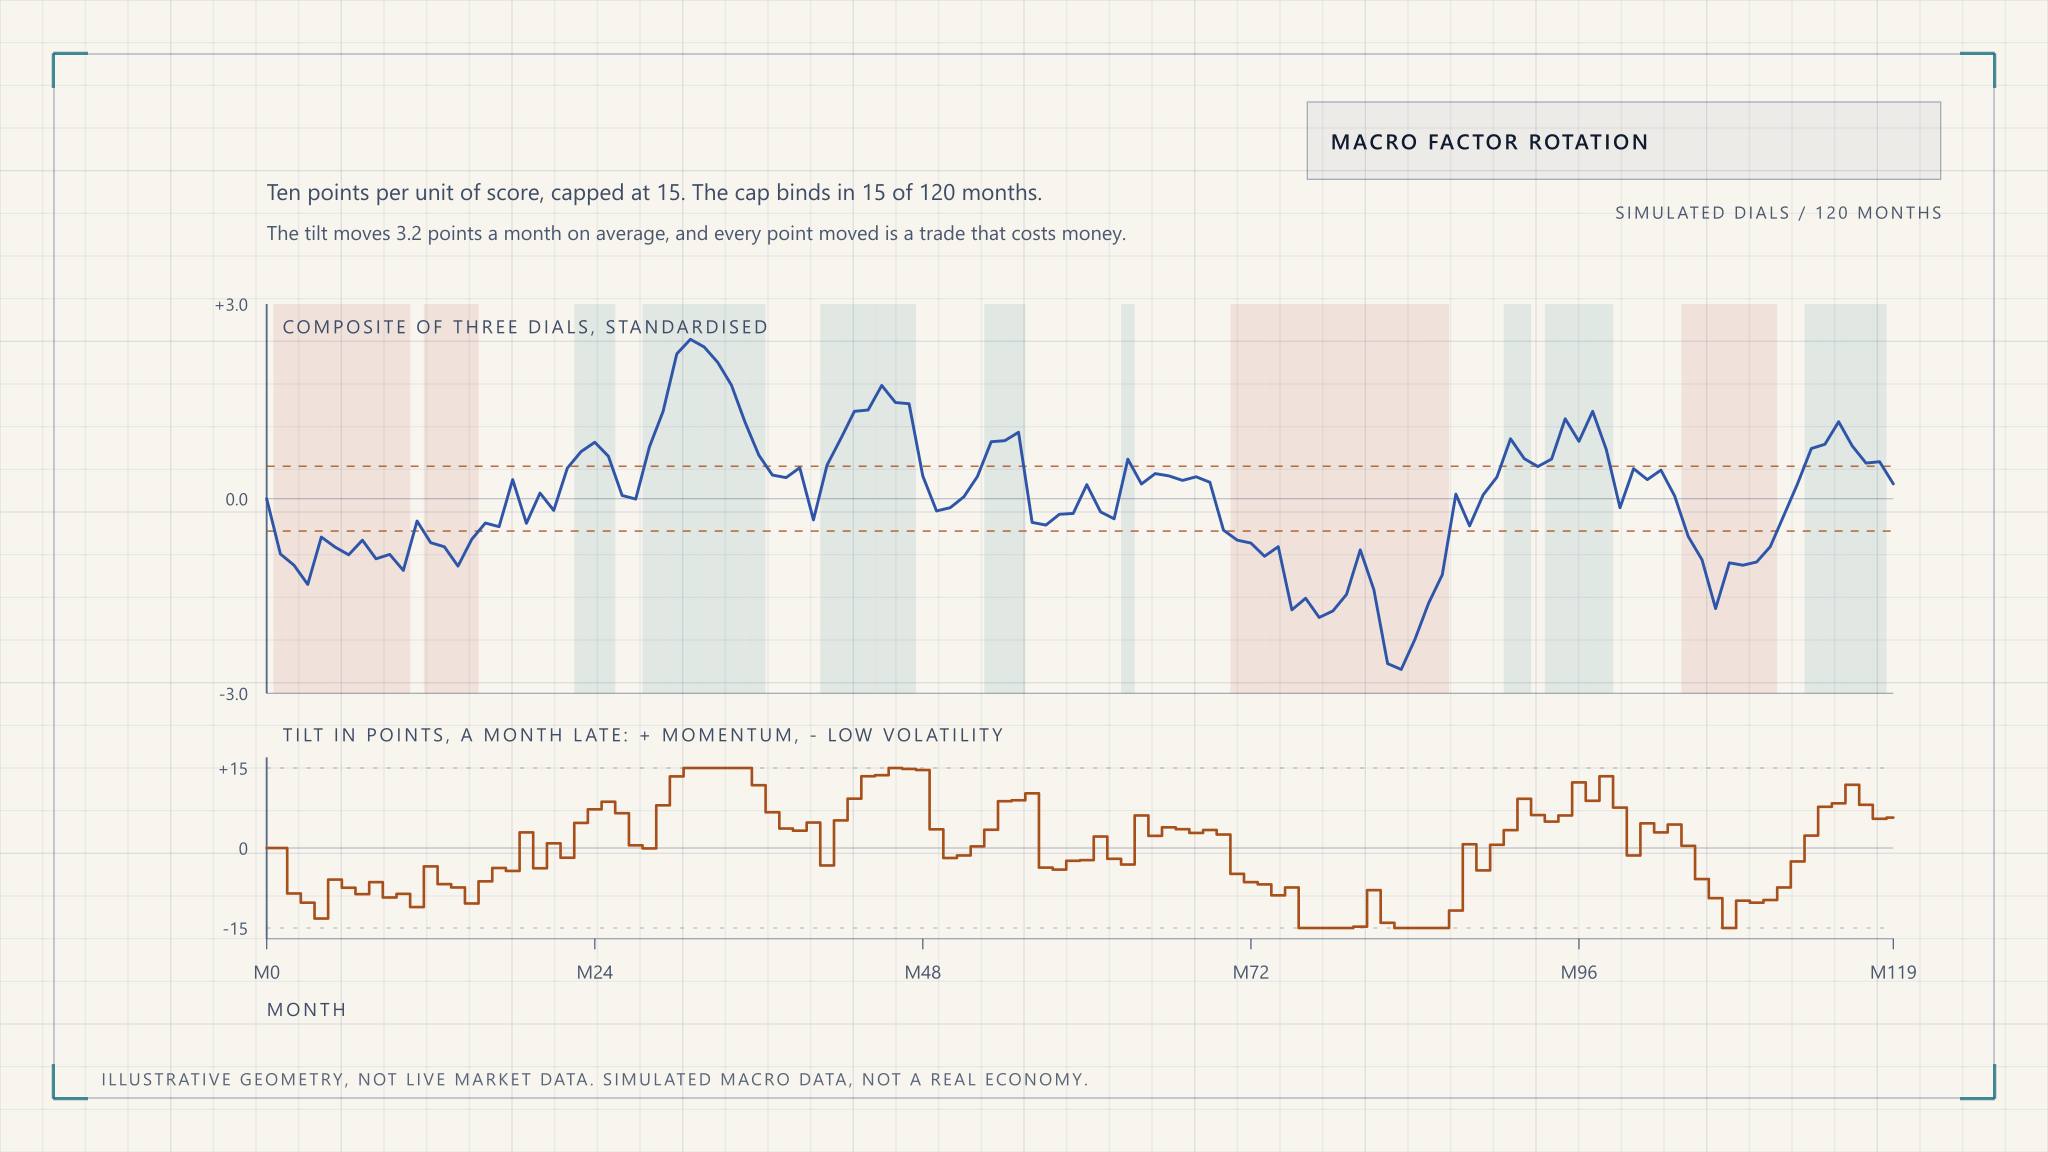
How to turn liquidity, PMI and yield-curve data into modest factor tilts, with guardrails, honest measurement, and the case that timing often fails.
Portfolio Management
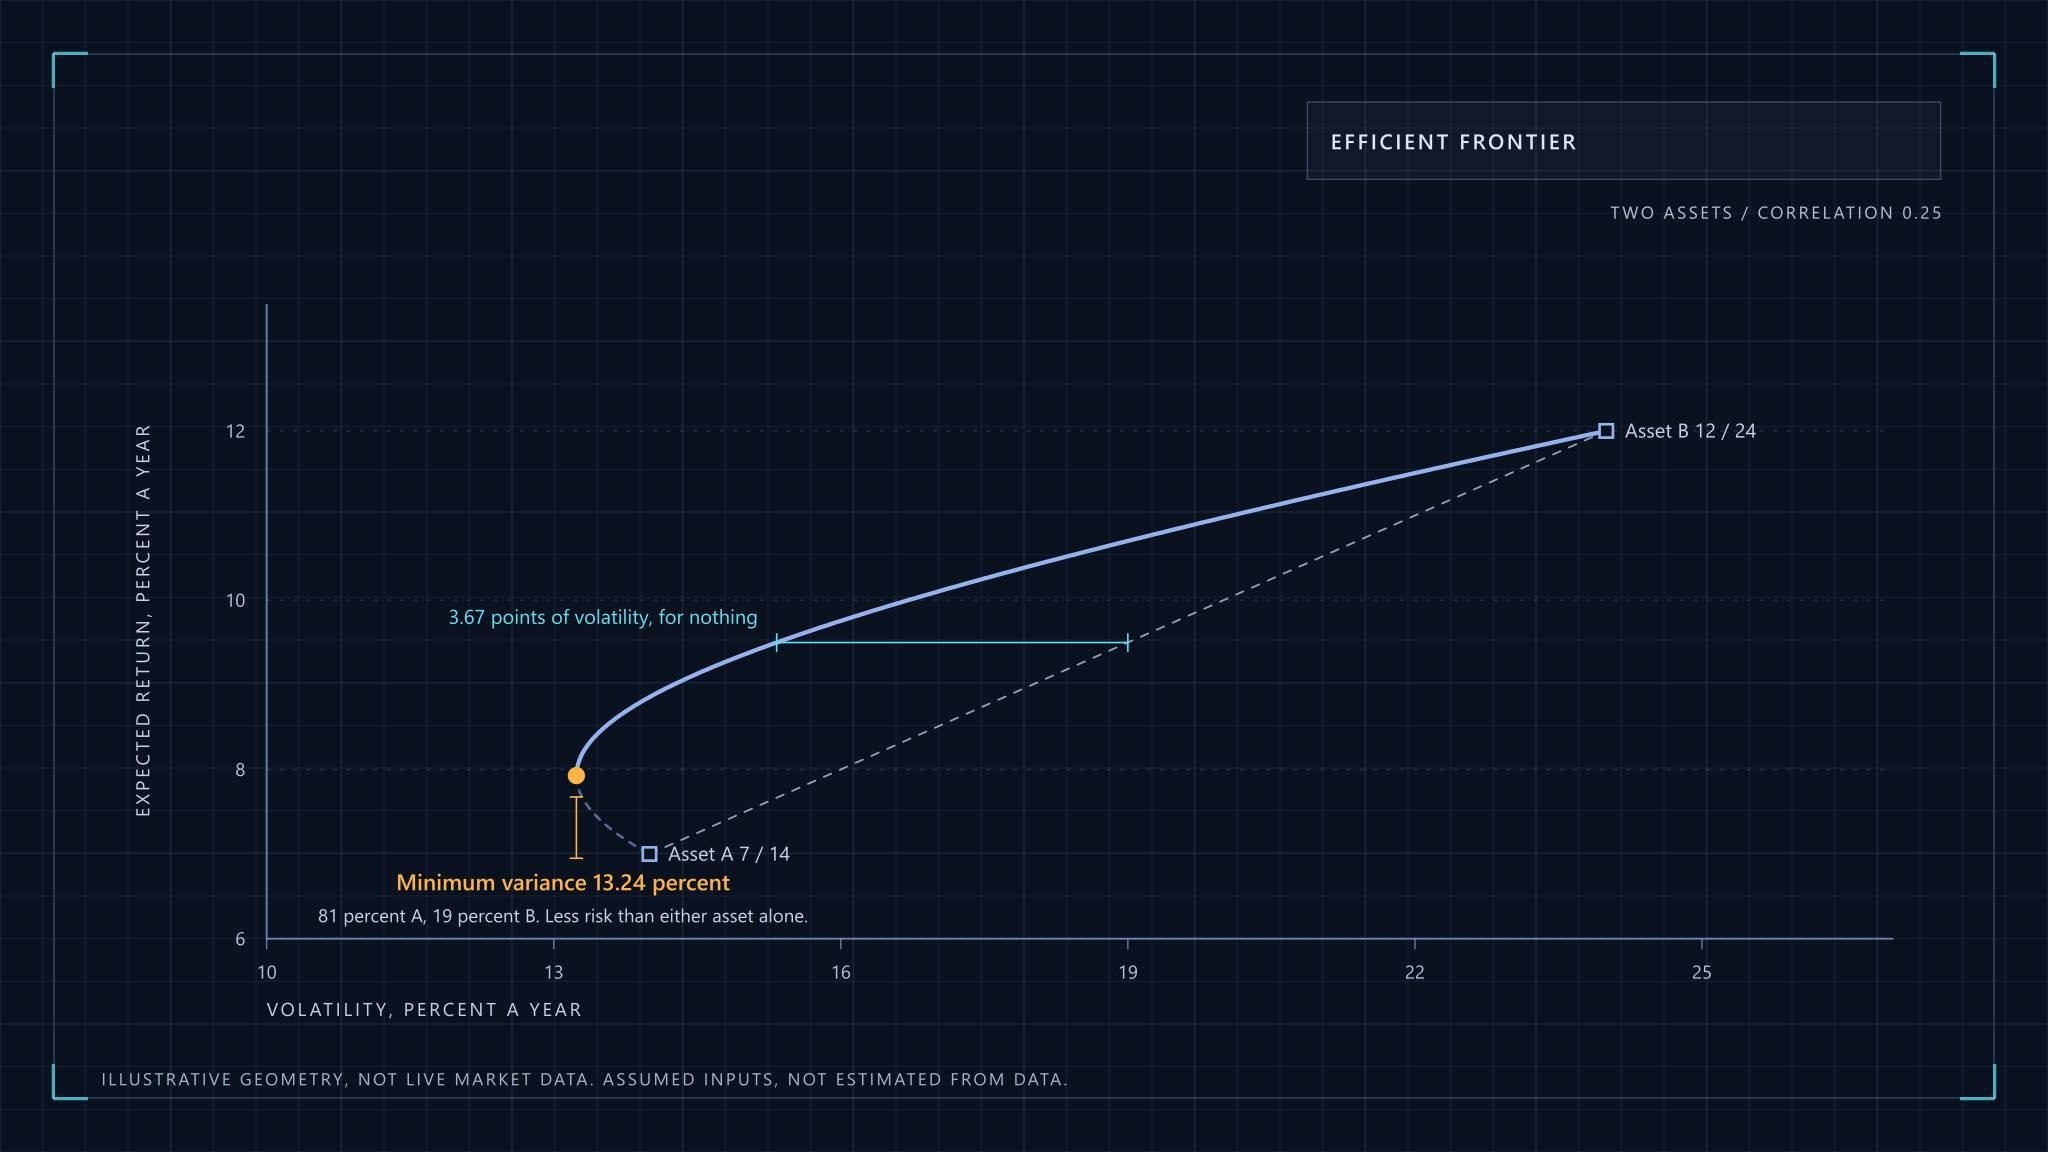
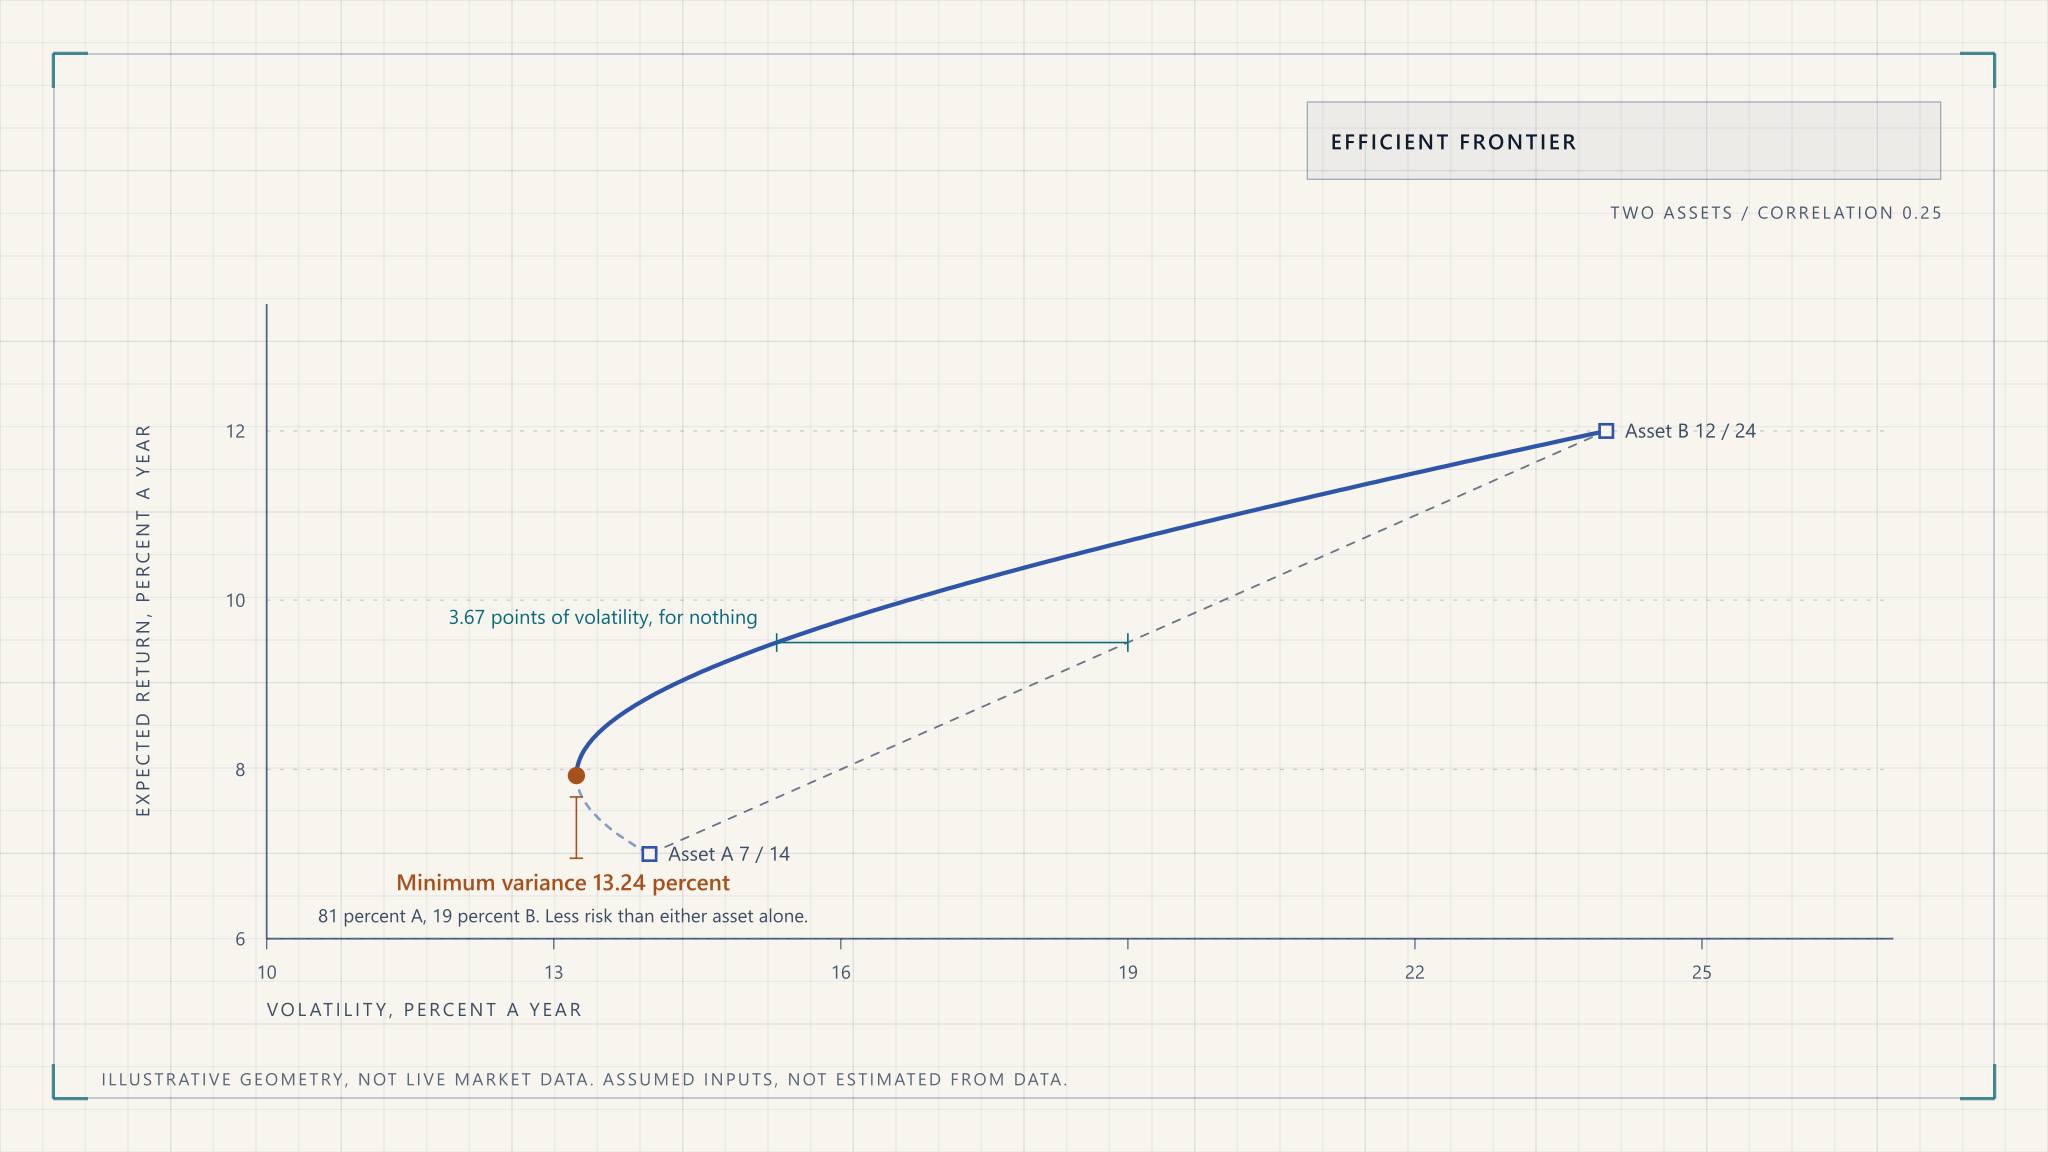
What portfolio construction is, the theory behind it, the process step by step, and why mean-variance optimisers build portfolios nobody should hold.
Reduced motion is on, so every card is laid out at once.
02 The reading path
The same fourteen, arranged as a route instead of a catalogue. Each rung assumes the ones above it, which is the order I would hand them to someone starting from scratch. The lattice is the same idea drawn properly: one lit path out of many.
From raw data to a signal you can trust. Start here: everything after it assumes this.
What a business is worth, and which statement to believe when the three disagree.
When price may move, and which of the claims made about charts survive a test.
Two indicators agreeing, and why that is weaker evidence than it looks.
Drawdowns, value at risk, and the point where both stop describing reality.
The same number by simulation: how it is built, and how far to trust its tail.
Single positions combined into a book whose risk profile you chose on purpose.
A book built for cash flow, where yield is the easy number and drawdown the real one.
Tilting between factors as the cycle turns, and the honest case that it rarely pays.
Models that find what you did not specify, and the new ways they fool you.
Two assets, one spread, and the costs that decide whether trading it pays.
Where options come in, because a hedge is the easiest option position to reason about.
Taking the other side of that trade, and what the premium is actually compensating.
Last, because a butterfly only makes sense once every rung above it does.
03 Method / four checks
Scroll and the rail runs them in order. Nothing gets written up until all four pass, and the ones that fail are the reason there are fourteen articles here rather than ninety.
Prices get adjusted, survivors get counted, and the sample is cut back to the information that actually existed at the time. Most of the work is here.
A fit is not a finding. Walk forward only, one holdout that is never touched twice, and a null model that has to be beaten before anything gets written down.
What the position loses, not what it makes. Drawdown, value at risk, and an honest note about the point where both stop describing reality.
Figures are computed from the data in the post rather than drawn to look right. Sources cite the primary document. Corrections are dated in place rather than made quietly.
The long version, including how market data is lagged and what is deliberately not covered, is in the editorial policy.